結論
入力
辞書型
portfolio = {"TSLA":[300],"AAPL":[903],"GOOG":[255],"MSFT":[999],"AMZN":[200]}
出力
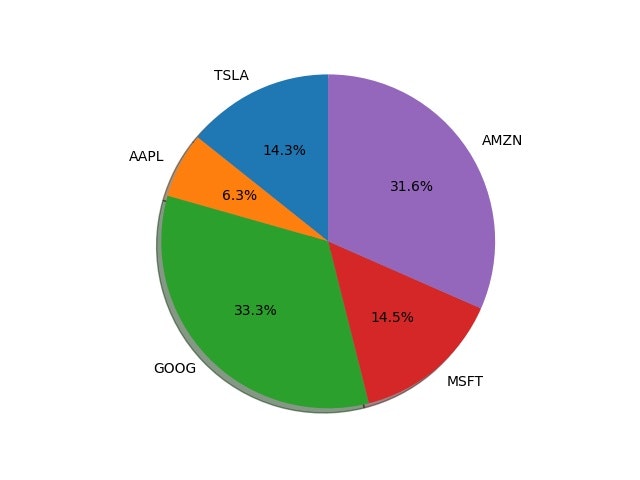
円グラフと最新価格のデータ、そして現在の合計資産
円グラフの%は保有金額ベース

Variable check okay. TSLA's current price : 1018.43 AAPL's current price : 149.32 GOOG's current price : 2793.44 MSFT's current price : 310.11 AMZN's current price : 3376.07 Your current total asset : 2137706 US Dollars.
ポートフォリオ情報の渡し方
portfolio = {"TSLA":[300],"AAPL":[903],"GOOG":[255],"MSFT":[999],"AMZN":[200]} #任意に書き換える
下から3行目を書き換える
株のシンボルをkey, 持ってる数をvalueとして辞書型で渡す。valueの方はあとで最新価格の情報を追加したいのでリストにしておく。
portfolio = {"株のシンボル_1 ex)AAPL":[持ってる株の数_1(int)],"株のシンボル_2":[持ってる株の数_2(int)],..."株のシンボル_n":[持ってる株の数_n(int)]}
※日本株非対応 日経平均 "^N225" は行けます。
import numpy as np
import pandas_datareader as dt
import datetime
from matplotlib import pyplot as plt

def get_Yesterday_Today():
    date_today=datetime.date.today()
    duration_oneday=datetime.timedelta(days=1)
    date_yesterday=date_today-duration_oneday
    return date_today, date_yesterday

def stock_search_to_prices(stock_symbol,start_date, end_date):
    df = dt.DataReader(stock_symbol,"yahoo", start_date, end_date)
    prices = df["Close"]
    return np.array(prices)

def add_price_info_to_portfolio(portfolio):
    date_today, date_yesterday = get_Yesterday_Today()
    for stock_symbol in portfolio:
        price_latest = stock_search_to_prices(stock_symbol,date_yesterday,date_today)[-1]
        if type(portfolio[stock_symbol][-1]) == int:
            portfolio[stock_symbol].append(price_latest)
        else:
            portfolio[stock_symbol][-1] = price_latest
    return portfolio

def process_data(up_to_date_portfolio):
    """
    It needs to be revised in the light of efficiency and readability.
    """
    labels = []
    sizes = []
    raw_amounts = []
    num_to_get_amount = 0
    num_to_get_price = 1
    total = 0
    for stock_symbol in up_to_date_portfolio:
        labels.append(stock_symbol)
        current_info = up_to_date_portfolio[stock_symbol]
        local_sum = current_info[num_to_get_amount] * current_info[num_to_get_price]
        raw_amounts.append(local_sum)
        total += local_sum
    if total == np.sum(raw_amounts): #This might be redundant but checking is important init.
        print("Variable check okay.")
    else:
        print(total,"vs",np.sum(raw_amounts))
        print("Something is wrong.")
    for amount in raw_amounts:
        sizes.append(amount/total)

    #Pie chart generation process.
    fig1, ax1 = plt.subplots()
    ax1.pie(sizes, labels=labels, autopct='%1.1f%%',
            shadow=True, startangle=90)
    ax1.axis('equal')
    plt.show()
    return total

def portfolio_to_piechart(portfolio):
    up_to_date_portfolio = add_price_info_to_portfolio(portfolio)
    total = process_data(up_to_date_portfolio)
    return up_to_date_portfolio, total

def process_info_to_show(info_,total):
    for name in info_:
        print("{}'s current price : {}".format(name,round(info_[name][1],2)))
    print("Your current total asset : {} US Dollars.".format(int(total)))


if __name__ == "__main__":
    portfolio = {"TSLA":[300],"AAPL":[903],"GOOG":[255],"MSFT":[999],"AMZN":[200]} #任意に書き換える
    info_, total= portfolio_to_piechart(portfolio)
    process_info_to_show(info_,total)
終わりに
最近読みやすいコードを意識しすぎてか変数が長くなってしまっている。意図とは裏腹に読みにくかったらご指摘ください。
また関数のstock_search_to_prices()も非常に便利ですのでご活用ください。