はじめに
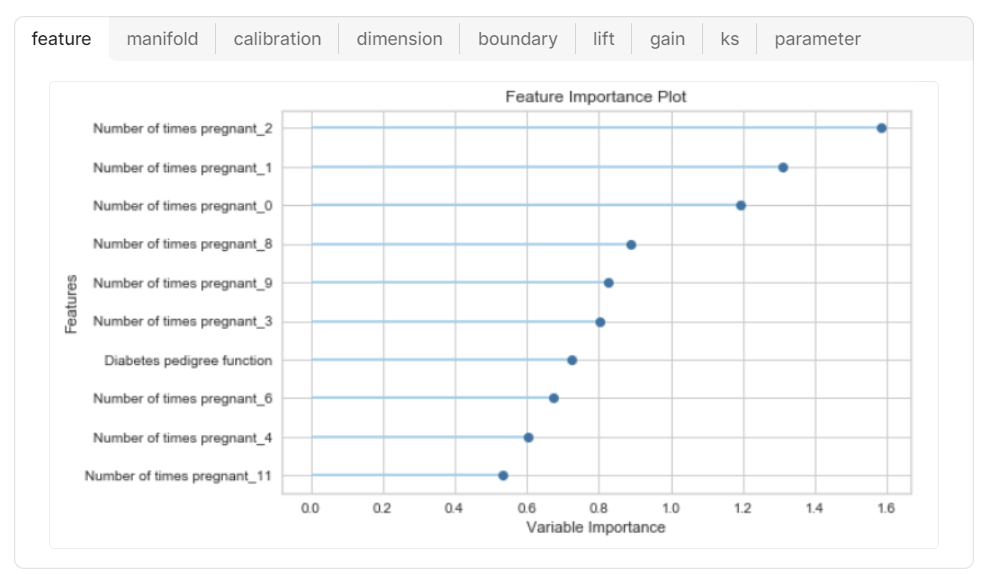
PyCaretを使って複数のモデルを比較する際、標準の特徴量重要度グラフを描くと、下記イメージのとおり上位10位まで表示できます。
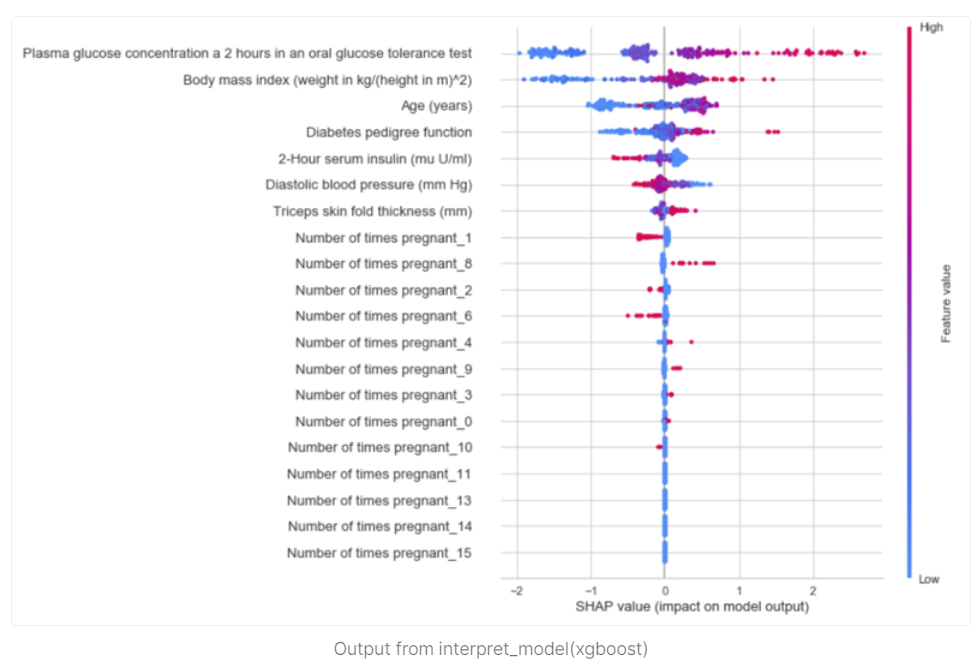
また、ツリー系のモデル(LGBM,XGBoostなど)であれば、SHAP値での評価も可能です。
ただし、特徴量重要度グラフは、「頻度」(決定木内の登場回数)で集計した特徴量のため、「ゲイン」とは傾向が異なります。(カテゴリよりも連続値の方が、区切れる自由度が大きく、上位に来やすい)
「ゲイン」で特徴量を見たほうが、目的変数をうまく仕分けるために重要な変数 という感覚とマッチしやすいです。
また、SHAPは、ゲインと近い傾向で評価をしてくれます。
課題
ここまでを踏まえての課題です。
・PyCaretでは、特徴量重要度グラフは、「頻度」しか出せない。
・SHAPは、ツリー系のモデル(LGBM,XGBoostなど)しか対応していない。
⇒ SHAP非対応のモデルを使ったときに、どの特徴量が重要なのか?を知りたい!
解決の方向性
こちらの本で紹介されている、「PFI(Permutation Feature Importance)」 を使います。
PFIの概要とコード
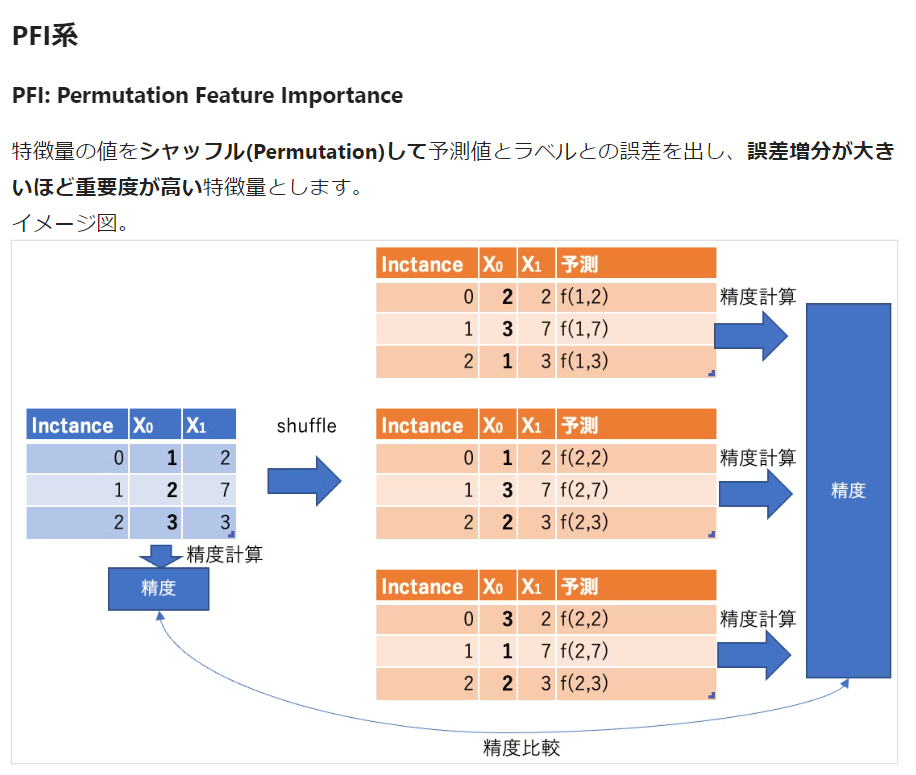
▼PFIの概要
こちらの記事が非常に参考になります!
図を引用させていただきます。
取組はいたってシンプルで、
「変数を1つずつシャッフルして予測させたときに、
精度が一番悪くなる特徴量は重要やで!」
という感じです💡
また、Predictできればどんなモデルにも適用可能! というのが一番の推しポイントですね✨
Pycaretでの実装
▼PFIの関数
モデルの評価がMSEだったため、PFIの評価もMSEです。
ここは、モデルに応じて、RMSE・MAE・accuracy・F1など変更してください💡
import numpy as np
import pandas as pd

def custom_permutation_importance(model, X, y, n_repeats=10, random_state=None):
    if random_state is not None:
        np.random.seed(random_state)

    baseline_score = model.predict(X) #予測値のみ取得できる。
    baseline_score = np.mean((baseline_score - y) ** 2)  # 予測値と正解の MSEを計算

    # 一つづつ列をシャッフルして、予測値を計算していく。
    importances = np.zeros(X.shape[1])
    for i in range(X.shape[1]):
        print(i,' / ',range(X.shape[1]))
        scores = np.zeros(n_repeats)
        for n in range(n_repeats):
            X_permuted = X.copy()
            np.random.shuffle(X_permuted.iloc[:, i].values)
            permuted_score = model.predict(X_permuted)
            scores[n] = np.mean((permuted_score - y) ** 2)
        importances[i] = baseline_score - np.mean(scores)

    return importances
▼全体の流れ
# 一時保管したデータフレームの読み込み
train_df = pd.read_pickle('train_df.pkl')
test_df = pd.read_pickle('test_df.pkl')

# PyCaretで作成・保存したモデルの読み込み
from pycaret.regression import load_model
model = load_model("Cat_model")

# X,yの設定
X = train_df_pfi.drop("target", axis=1)
y = train_df_pfi["target"]

# カスタム`permutation_importance`を実行
importances = custom_permutation_importance(model, X, y, n_repeats=10, random_state=42)


# 結果の表示
importance_df = pd.DataFrame(np.abs(importances), index=X.columns, columns=['Importance']).sort_values(by='Importance', ascending=False)
importance_df

# データフレームを一時保管
importance_df.to_pickle('importances.pkl')


import matplotlib.pyplot as plt
# 上位15変数 を 横棒グラフを作成
plt.figure(figsize=(20, 16))
importance_df.head(15).plot(kind='barh', legend=False,fontsize=5)
plt.xlabel('Importance')
plt.title('Feature Importance')
plt.gca().invert_yaxis()  # y軸を逆順にすることで重要な特徴量が上に来るようにする
plt.tight_layout()
plt.subplots_adjust(left=0.25, right=0.95, top=0.95, bottom=0.1)  # 間隔を調整
plt.savefig('feature_importance.jpeg', format='jpeg', dpi=300)  # PNG形式で保存
plt.show()
▼アウトプット
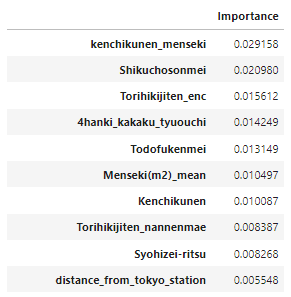
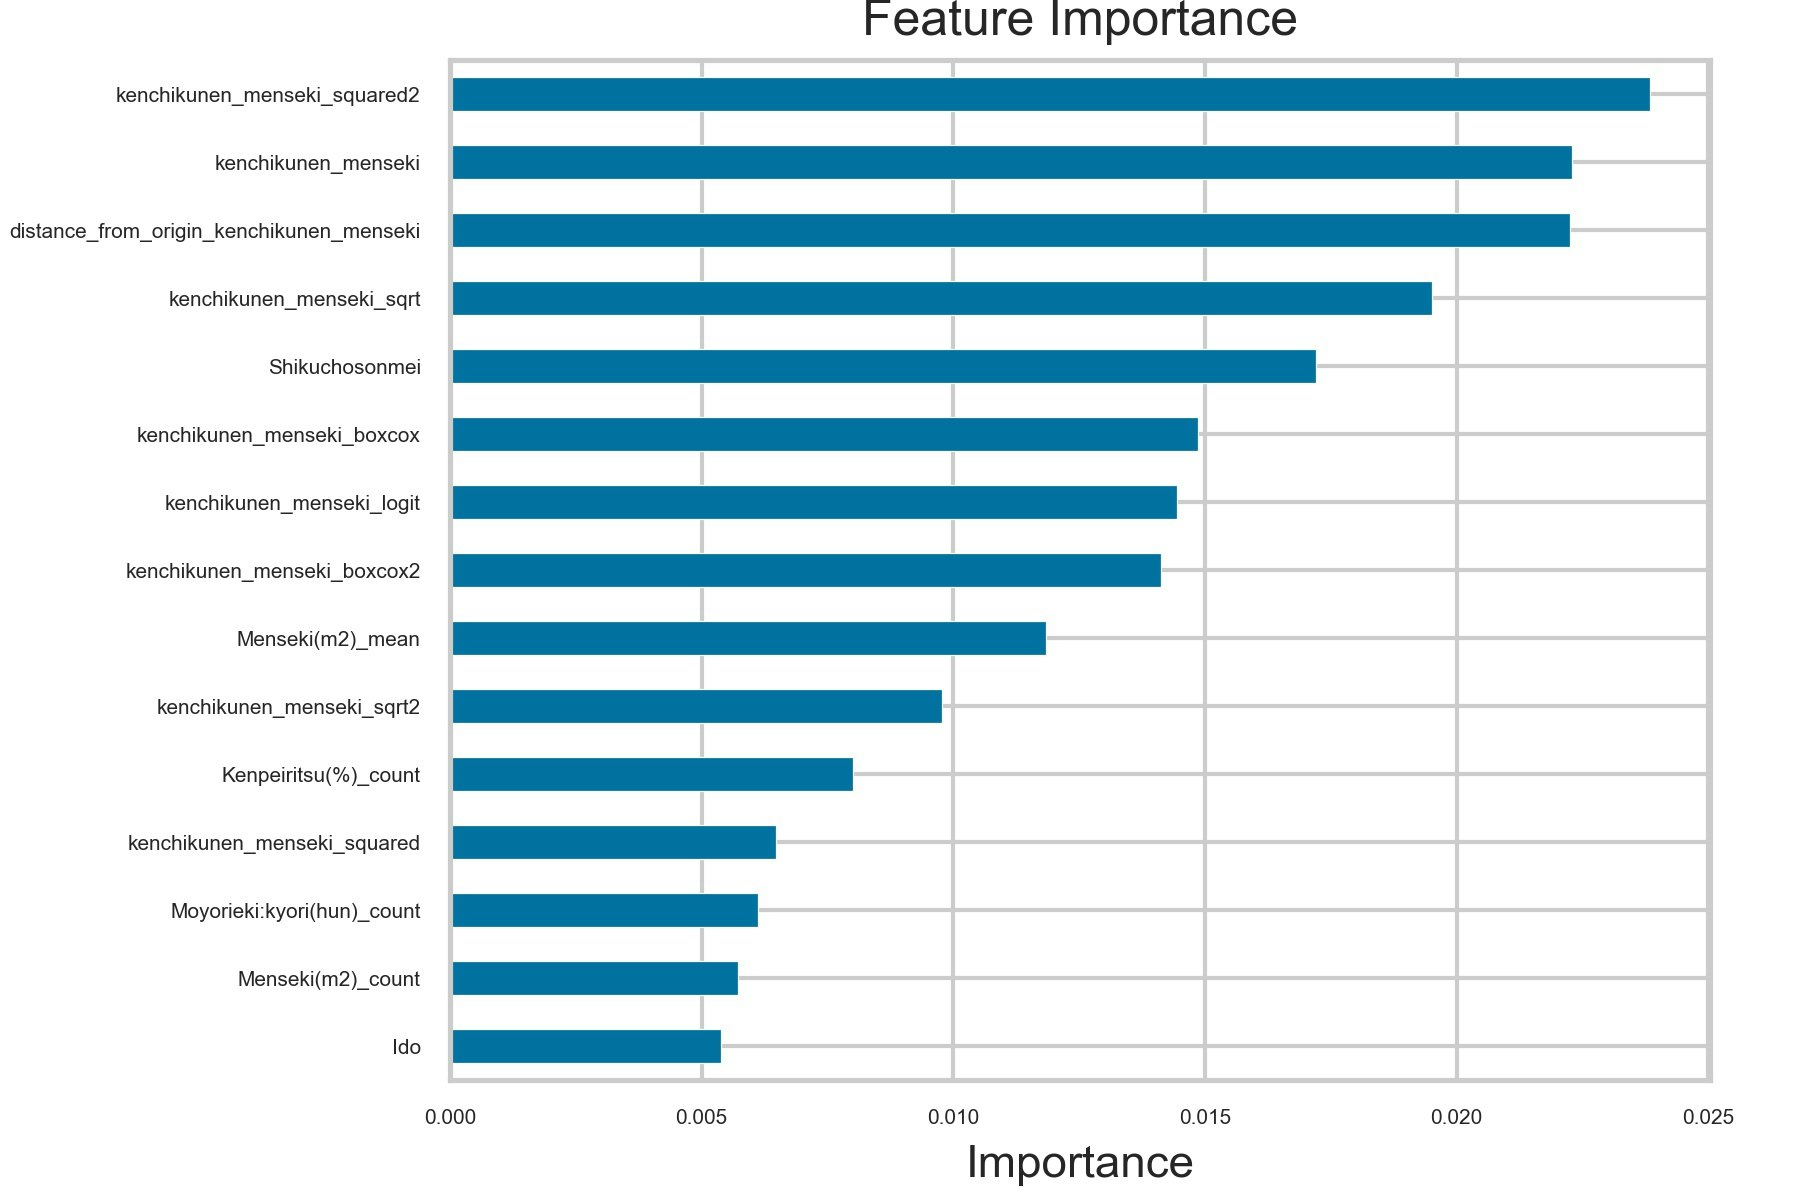
importance_df は、下記イメージで特徴量ごとの重要度が出力されます✨
この例では、kenchikunen_mensekiという列が最も重要です。
グラフでは、上位15位まで可視化しています🚩
こうしてみると一目瞭然で、社内の説明用パワポにそのまま使えそうですね!
終わりに
今回は、PyCaretでPFI算出(特徴量重要度の算出)を実装しました💡
PyCaretでたくさんのモデルを簡単に使えるので、PFIを組み込むことで幅が広がりますねー!
