背景
matplotlibでデータを可視化していたら、棒グラフを折れ線グラフを重ねて表示できないのかと思った。(異なる種類のグラフはそれぞれ別のグラフに出すのをよく見るので)
簡単にできると思っていたら苦労したので、可視化できるまでに必要だった知識をまとめる
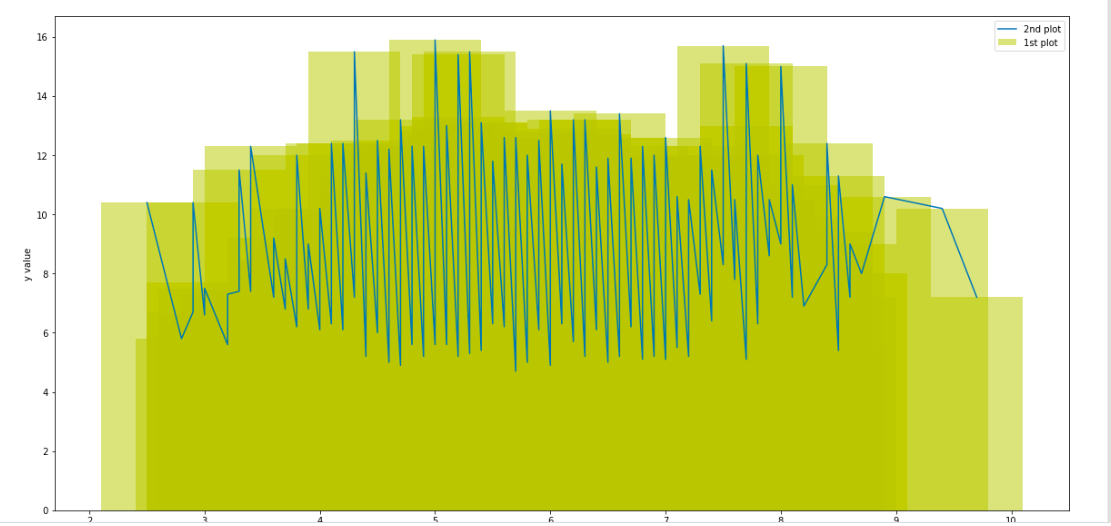
最終的作成したコードとグラフ
# Importing required packages.
import pandas as pd
import seaborn as sns
import matplotlib.pyplot as plt
from sklearn.ensemble import RandomForestClassifier
from sklearn.svm import SVC
from sklearn.linear_model import SGDClassifier
from sklearn.metrics import confusion_matrix, classification_report
from sklearn.preprocessing import StandardScaler, LabelEncoder
from sklearn.model_selection import train_test_split, GridSearchCV, cross_val_score
%matplotlib inline
# Loading dataset
train_df = pd.read_csv('./input/train.csv')
test_df = pd.read_csv('./input/test.csv')
# plot用のsort済みデータを作成
line_df = train_df.sort_values(by=["quality","fixed acidity"])
fig = plt.figure(figsize = (20,10))
ax = fig.add_subplot(1,1,1) # Axesを作成
line1= ax.bar('quality', 'fixed acidity', data = train_df, label='1st plot',alpha=0.5,color='y') # Axes.linesにLine2Dを追加
line2 = ax.plot('quality', 'fixed acidity', data = line_df, label='2nd plot') # Axes.linesにLine2Dを追加
ax.legend()
ax.set_xlabel('x value')
ax.set_ylabel('y value')
```
出力結果

## matplotlibの構造の知識
今までplt.plot()のカッコ内にデータ突っ込むくらいしか知識が無かったが、他にオブジェクト思考的にグラフの部品部品を作成していくようなイメージの作り方があった。
イメージはグラフを作成する土台(figure)を作成し、その上にグラフをかく板(axes)、その上に軸たち(Axis)を作成していくというもの。
で作り終わった後に、グラフをかく板(axes)にあるグラフを表示する機能(axes.plotなど)を使って描写できる。
こっちのオブジェクト指向的な方が、各パーツをイメージしながら作成できるので細かい部分を調整する場合は良いらしい。
[詳しくはこちら](https://qiita.com/skotaro/items/08dc0b8c5704c94eafb9)
## matplotlib.axes.Axes.plotの罠
axes.plot()で2箇所ほどつまづいた。
<b>1点目</b>
最初はx = ,y = のような感じでデータを直接指定したがエラーが出た。
原因は今回dataframeオブジェクトを渡したので、オプションにはデータのカラム名のみ記入する必要があった。
下がmatplotlib.axes.Axes.plotのドキュメント
>
There's a convenient way for plotting objects with labelled data (i.e. data that can be accessed by index obj['y']). Instead of giving the data in x and y, you can provide the object in the data parameter and just give the labels for x and y:
>>> plot('xlabel', 'ylabel', data=obj)
[matplotlib.axes.Axes.plotのドキュメント]
(https://matplotlib.org/3.1.1/api/_as_gen/matplotlib.axes.Axes.plot.html)
下が解決したコード部分
```python
line2 = ax.plot('quality', 'fixed acidity', data = line_df, label='2nd plot')
```
<b>2点目</b>
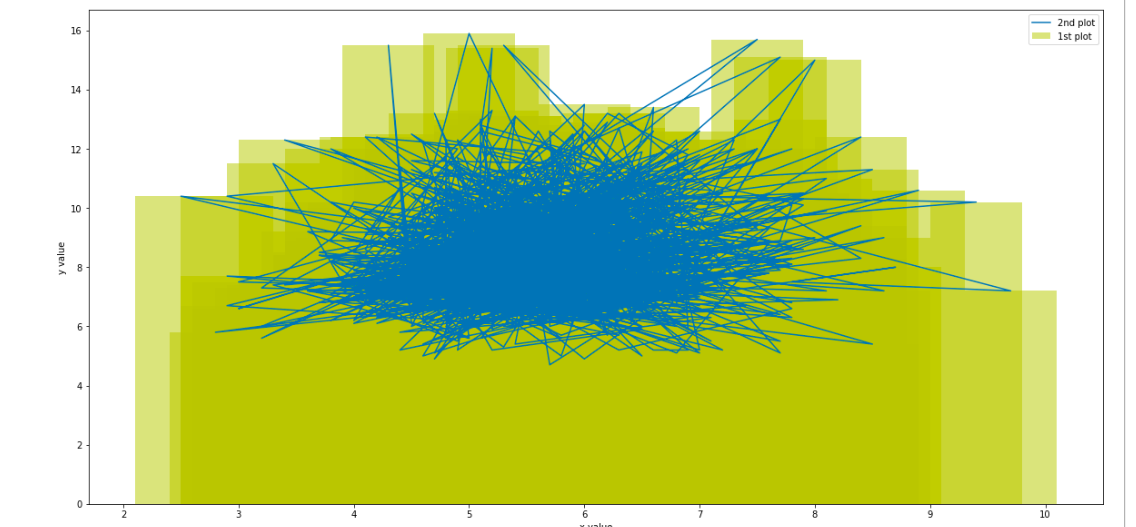
axes.plot()で折れ線グラフを作ったがこれはarray配列の最初からプロットされた点をただ結んでいくので、順番を揃えないとぐちゃぐちゃなグラフが出来上がった。(下図はイメージ)

X軸とY軸で順番をsortしたdataframeを新しく作成することで解決
```python
line_df = train_df.sort_values(by=["quality","fixed acidity"])
```