初めに
AWSのデータベース(MySQL on RDS)に作成したテーブルの内容を、Pythonのデータ可視化フレームワークDashを使用してWeb上に表示します。
※ 今回はdashのコードが中心です。EC2やRDSのインスタンス作成、TeraTermでの接続等は省略します。
環境
データベース
- RDSにMySQLインスタンスを生成(最小構成)
- インスタンスクラス:db.t3.micro
- ストレージ:20GiB
- マルチAZ:なし
- Serverバージョンは8.0.28だが、AWSがメンテナンスしているので変わるかも。
サーバー
- EC2インスタンスを起動
- AMI:Ubuntu Server 20.04 LTS (HVM), SSD Volume Type
- インスタンスタイプ:t2.micro
- ストレージ:汎用SSD 8GB
EC2からデータベースへの接続
RDSのデータベースは、デフォルトでdefault(という名前の)セキュリティグループが設定されているインスタンスからのみ接続を受け付けます。
このため、EC2インスタンスにdefaultセキュリティグループを割り当てます。
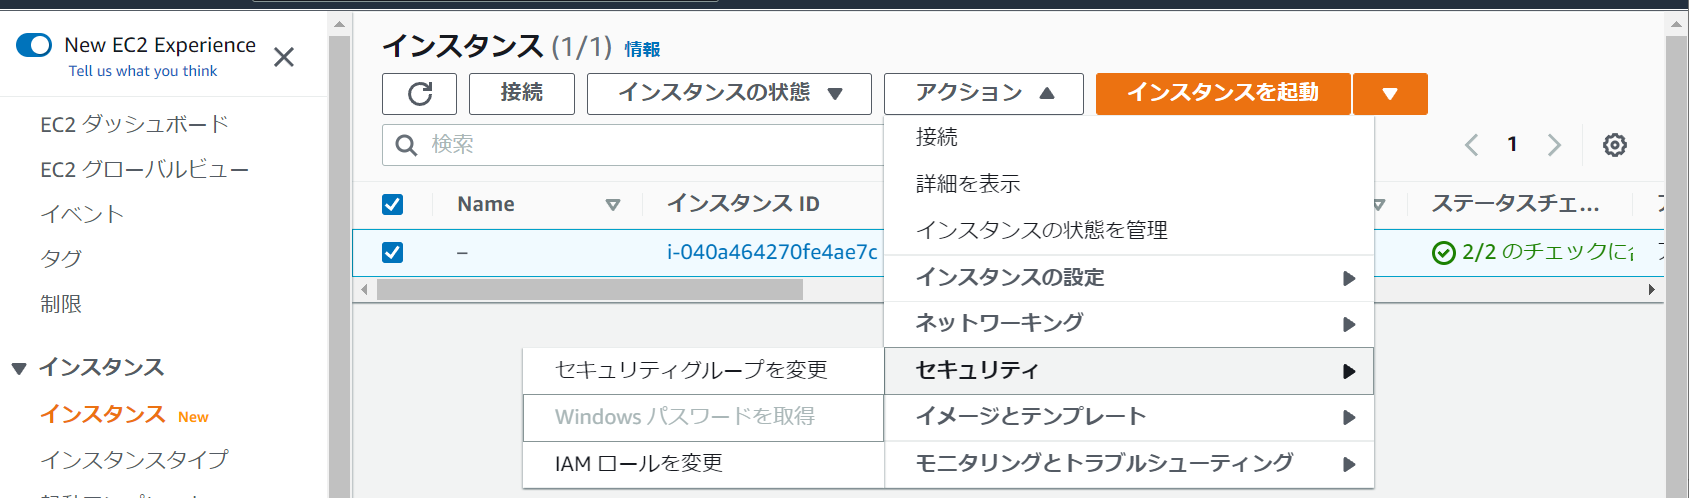
EC2へのセキュリティグループ割り当て
-
EC2インスタンスを一覧で選択し、「アクション」-「セキュリティ」-「セキュリティグループを変更」を選択します。
-
関連付けられたセキュリティグループ欄をクリックし、「default」という名前のセキュリティグループを選択します。

-
「セキュリティグループを追加」ボタンをクリックしてセキュリティグループを追加します。その後「保存」をクリックします。

EC2からRDSへの接続
EC2インスタンスにTera Term等で接続し、aptを使用してmysqlクライアントをインストールします。
sudo apt update
sudo apt -y upgrade
sudo apt -y install mysql-client
RDSのインスタンス詳細ページから、エンドポイントをコピーします。
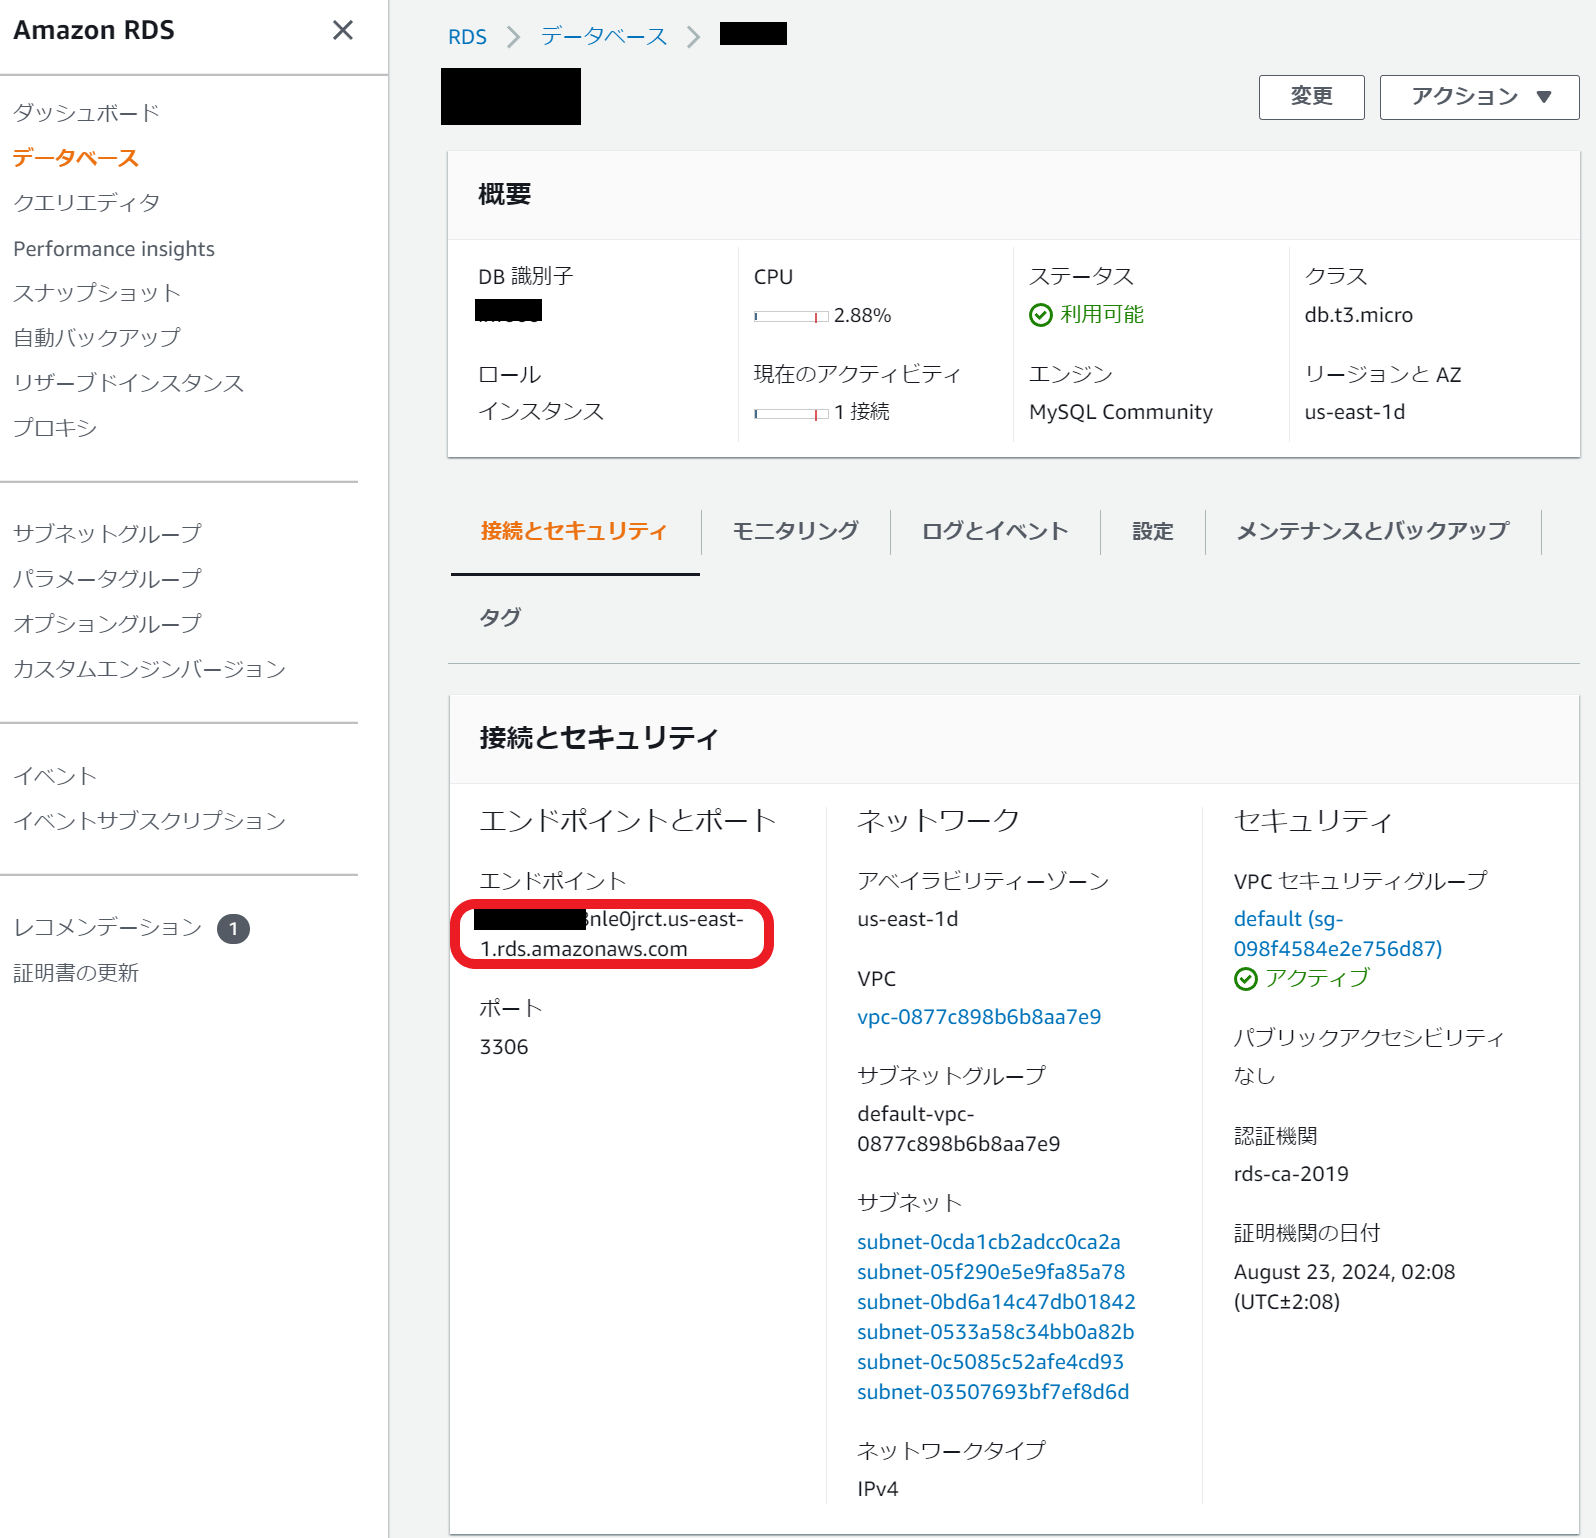
mysqlコマンドを使用して接続します。(この例ではデータベースユーザー名adminです)
mysql -h xxxxxx.ct18nle0jrct.us-east-1.rds.amazonaws.com -u admin -p

Enter password:
Welcome to the MySQL monitor.  Commands end with ; or \g.
Your MySQL connection id is 3391
Server version: 8.0.28 Source distribution

Copyright (c) 2000, 2022, Oracle and/or its affiliates.

Oracle is a registered trademark of Oracle Corporation and/or its
affiliates. Other names may be trademarks of their respective
owners.

Type 'help;' or '\h' for help. Type '\c' to clear the current input statement.

mysql>
ターゲットとなるデータベース
今回のデータは、一応IoTシステムを模擬しています。データベースの名前はIotDB、テーブル名はEnvironmentです。
| 列名 | 型 | 制約 | 内容 |
|---|---|---|---|
| EnvID | INT | PRIMARY KEY | 主キー |
| Name | VARCHAR(256) | NOT NULL | デバイス名 |
| Humid | VARCHAR(64) | NOT NULL | 湿度 |
| Temperature | VARCHAR(64) | NOT NULL | 温度 |
| Pressure | VARCHAR(64) | NOT NULL | 気圧 |
| R | VARCHAR(64) | NOT NULL | 照度(赤) |
| G | VARCHAR(64) | NOT NULL | 照度(緑) |
| B | VARCHAR(64) | NOT NULL | 照度(青) |
| Ir | VARCHAR(64) | NOT NULL | 照度(赤外) |
| timestamp | DATETIME | NOT NULL | 測定時刻 |
テーブルのDDLを記載しておきます。
CREATE DATABASE IotDB;
USE IotDB;
CREATE TABLE `Environment` (
  `EnvID` int NOT NULL AUTO_INCREMENT,
  `Name` varchar(256) NOT NULL,
  `Humid` varchar(64) NOT NULL,
  `Temperature` varchar(64) NOT NULL,
  `Pressure` varchar(64) NOT NULL,
  `R` varchar(64) NOT NULL,
  `G` varchar(64) NOT NULL,
  `B` varchar(64) NOT NULL,
  `Ir` varchar(64) NOT NULL,
  `timestamp` datetime NOT NULL,
  PRIMARY KEY (`EnvID`)
);
こんな感じのデータが入っています。
+-------+----------+-------------------+--------------------+--------------------+-----+-----+-----+----+---------------------+
| EnvID | Name     | Humid             | Temperature        | Pressure           | R   | G   | B   | Ir | timestamp           |
+-------+----------+-------------------+--------------------+--------------------+-----+-----+-----+----+---------------------+
|     1 | Sensor01 | 72.96240278572691 | 27.52515602764324  | 1004.5203338489897 | 627 | 498 | 175 | 67 | 2022-07-16 12:11:22 |
|     2 | Sensor01 | 72.93764055908353 | 27.54032935278956  | 1004.5454312081312 | 628 | 498 | 175 | 67 | 2022-07-16 12:11:56 |
|     3 | Sensor01 | 72.84016199119625 | 27.555502680555218 | 1004.5983154996351 | 546 | 428 | 156 | 61 | 2022-07-16 12:17:09 |
|     4 | Sensor01 | 72.89089774275293 | 27.54032935278956  | 1004.350930017241  | 634 | 509 | 182 | 69 | 2022-07-16 12:22:24 |
|     5 | Sensor01 | 72.8205940464291  | 27.63642713954323  | 1004.3986951816456 | 671 | 493 | 173 | 74 | 2022-07-16 12:30:07 |
+-------+--------------+-------------------+--------------------+--------------------+-----+-----+-----+----+---------------------+
dash+plotlyで可視化
以上で準備ができたので、Pythonアプリを作成します。
Python3とライブラリのインストール
sudo apt -y install python3
sudo apt -y install python3-pip
sudo pip3 install dash
sudo pip3 install pandas
sudo pip3 install pymysql
MySQLへ接続してデータを取得するモジュール
import pymysql
import pandas as pd
from configure import configure

#データベースの情報を設定ファイルから取り出す
mysql_host = configure.mysql_host
mysql_user = configure.mysql_user
mysql_pass = configure.mysql_pass
dbname = configure.dbname

def connect():
    try:
        # データベースと接続する
        conn = pymysql.connect(host=mysql_host,
                user=mysql_user,
                password=mysql_pass,
                db=dbname,
                connect_timeout=5)
    except pymysql.MySQLError as e:
        print(e)
        exit()
    return conn

# データベースからモノのデータを取得する
# ※モノの名前毎に取得して配列に格納する
def getThingData():
    # データベースと接続する
    conn = connect()
    cur = conn.cursor()
    cur.execute("SELECT DISTINCT Name FROM Environment")
    rows = cur.fetchall()
    things={}
    for r in rows:
        things[r[0]] = getData(conn, name=r[0])

    return things

# モノの名前を指定してデータを取得する
def getData(conn, name = "MyThing"):
    cur = conn.cursor()
    cur.execute("SELECT Name, "
            + "Humid, "
            + "Temperature, "
            + "Pressure, "
            + "CONVERT_TZ(timestamp, '+00:00', '+09:00'), "
            + "R, "
            + "G, "
            + "B, "
            + "Ir "
            + "FROM Environment "
            + "WHERE Name = %s "
            + "ORDER BY timestamp DESC "
            + "LIMIT 1000", name)
    rows = cur.fetchall()

    # SELECT 結果を二次元テーブルに展開する
    df = pd.DataFrame([[c for c in r] for r in rows])
    # 取り出したオブジェクトにはカラム名がないので、名前をつける
    df = df.rename(
    columns={0:'Name',
    1:'Humid',
    2:'Temperature',
    3:'Pressure',
    4:'Timestamp',
    5:'R',
    6:'G',
    7:'B',
    8:'Ir'})
    # 生成したデータを返す
    return df
class configure:
    mysql_host = "xxxxx.abcdefgt.us-east-1.rds.amazonaws.com"
    mysql_user = "admin"
    mysql_pass = "password"
    dbname = "IotDB"
    thing = "Sensor01"
データ可視化Webアプリ
import dash
import dash_core_components as dcc
import dash_html_components as html
import plotly.graph_objects as go
from dash.dependencies import Input, Output
import pandas as pd
import mysql
# スタイルシートを設定する
external_stylesheets = ['https://codepen.io/chriddyp/pen/bWLwgP.css']
app = dash.Dash(__name__, external_stylesheets=external_stylesheets)
# 画面データを生成する
app.layout = html.Div(children=[
    html.H1(children='環境センサデータ'),
    html.Div(children='''
        IoT デバイスのデータを可視化します。
    '''),
    # 温度グラフ
    dcc.Graph(
        id='temp',
    ),
    # 湿度グラフ
    dcc.Graph(
        id='humid',
    ),
    # 気圧グラフ
    dcc.Graph(
        id='press',
    ),
    # カラーグラフ
    dcc.Graph(
        id='csensor',
    ),
    # 定期的にリロードする設定
    dcc.Interval(
        id="reload",
        interval=30000
    ),

])
# リロード処理のコールバック (湿度グラフの更新)
@app.callback([
        Output("humid", "figure"),
        Output("temp", "figure"),
        Output("press", "figure"),
        Output("csensor", "figure")],
        [Input("reload", "n_intervals")])
def humid_figure(n):
    # MySQL(RDS)に接続してデータを取り出す
    things = mysql.getThingData()
    # 湿度のグラフを作成する
    humid_fig = put_figure(
        "Humid",
        "湿度データ",
        {
            "type":"linear",
            "range":[0,100],
            "title":"湿度"
        },
        things)
    # 気圧のグラフを生成する
    press_fig = put_figure(
        "Pressure",
        "気圧データ",
        {
            "type":"linear",
            # "range":[900,1100],
            "title":"気圧"
        },
        things)
    # 温度のグラフを生成する
    temp_fig = put_figure(
        "Temperature",
        "気温データ",
        {
            "type":"linear",
            # "range":[-10,40],
            "title":"気温"
        },
        things)
    # カラーグラフを生成する
    color_fig = go.Figure(
        layout={
            'title':'カラーデータ',
            'yaxis':{
                'type':'linear',
                'title':'Color'},
            'xaxis':{
                'title':'Timestamp'}
        })
    # 名前をキーに辞書へ登録されているので、
    # キーを取り出して順番に処理する
    for tname in things.keys():
        # データを取り出してグラフに追加する
        color_fig.add_trace(
            go.Scatter(
                y = things[tname]["B"],
                x = things[tname]["Timestamp"],
                mode = 'lines',
                name = 'B - ' + tname,
        ))
        color_fig.add_trace(
            go.Scatter(
                y = things[tname]["R"],
                x = things[tname]["Timestamp"],
                mode = 'lines',
                name = 'R - ' + tname,
        ))
        color_fig.add_trace(
            go.Scatter(
                y = things[tname]["G"],
                x = things[tname]["Timestamp"],
                mode = 'lines',
                name = 'G - ' + tname,
        ))

    return humid_fig, temp_fig, press_fig, color_fig

# モノのデータをグラフに表示する
def put_figure(column, title, yaxis, things):
    # グラフを作成する
    figure = go.Figure(
        layout={
            "title":title,
            "yaxis":yaxis,
            "xaxis":{"title":"時刻"}
    })
    # 名前をキーに辞書へ登録されているので、
    # キーを取り出して順番に処理する
    for tname in things.keys():
        # データを取り出してグラフに追加する
        figure.add_trace(
            go.Scatter(
                y = things[tname][column],
                x = things[tname]["Timestamp"],
                mode = "lines",
                name = tname
        ))
    return figure

# サーバーを起動する
if __name__ == '__main__':
    app.run_server(debug=True, port=80, host='0.0.0.0')
アプリ起動
アプリはapp.pyを実行することで起動されます。
Webサーバーを起動するためか、Permission deniedになるのでsudoで起動します。
sudo python3 app.py
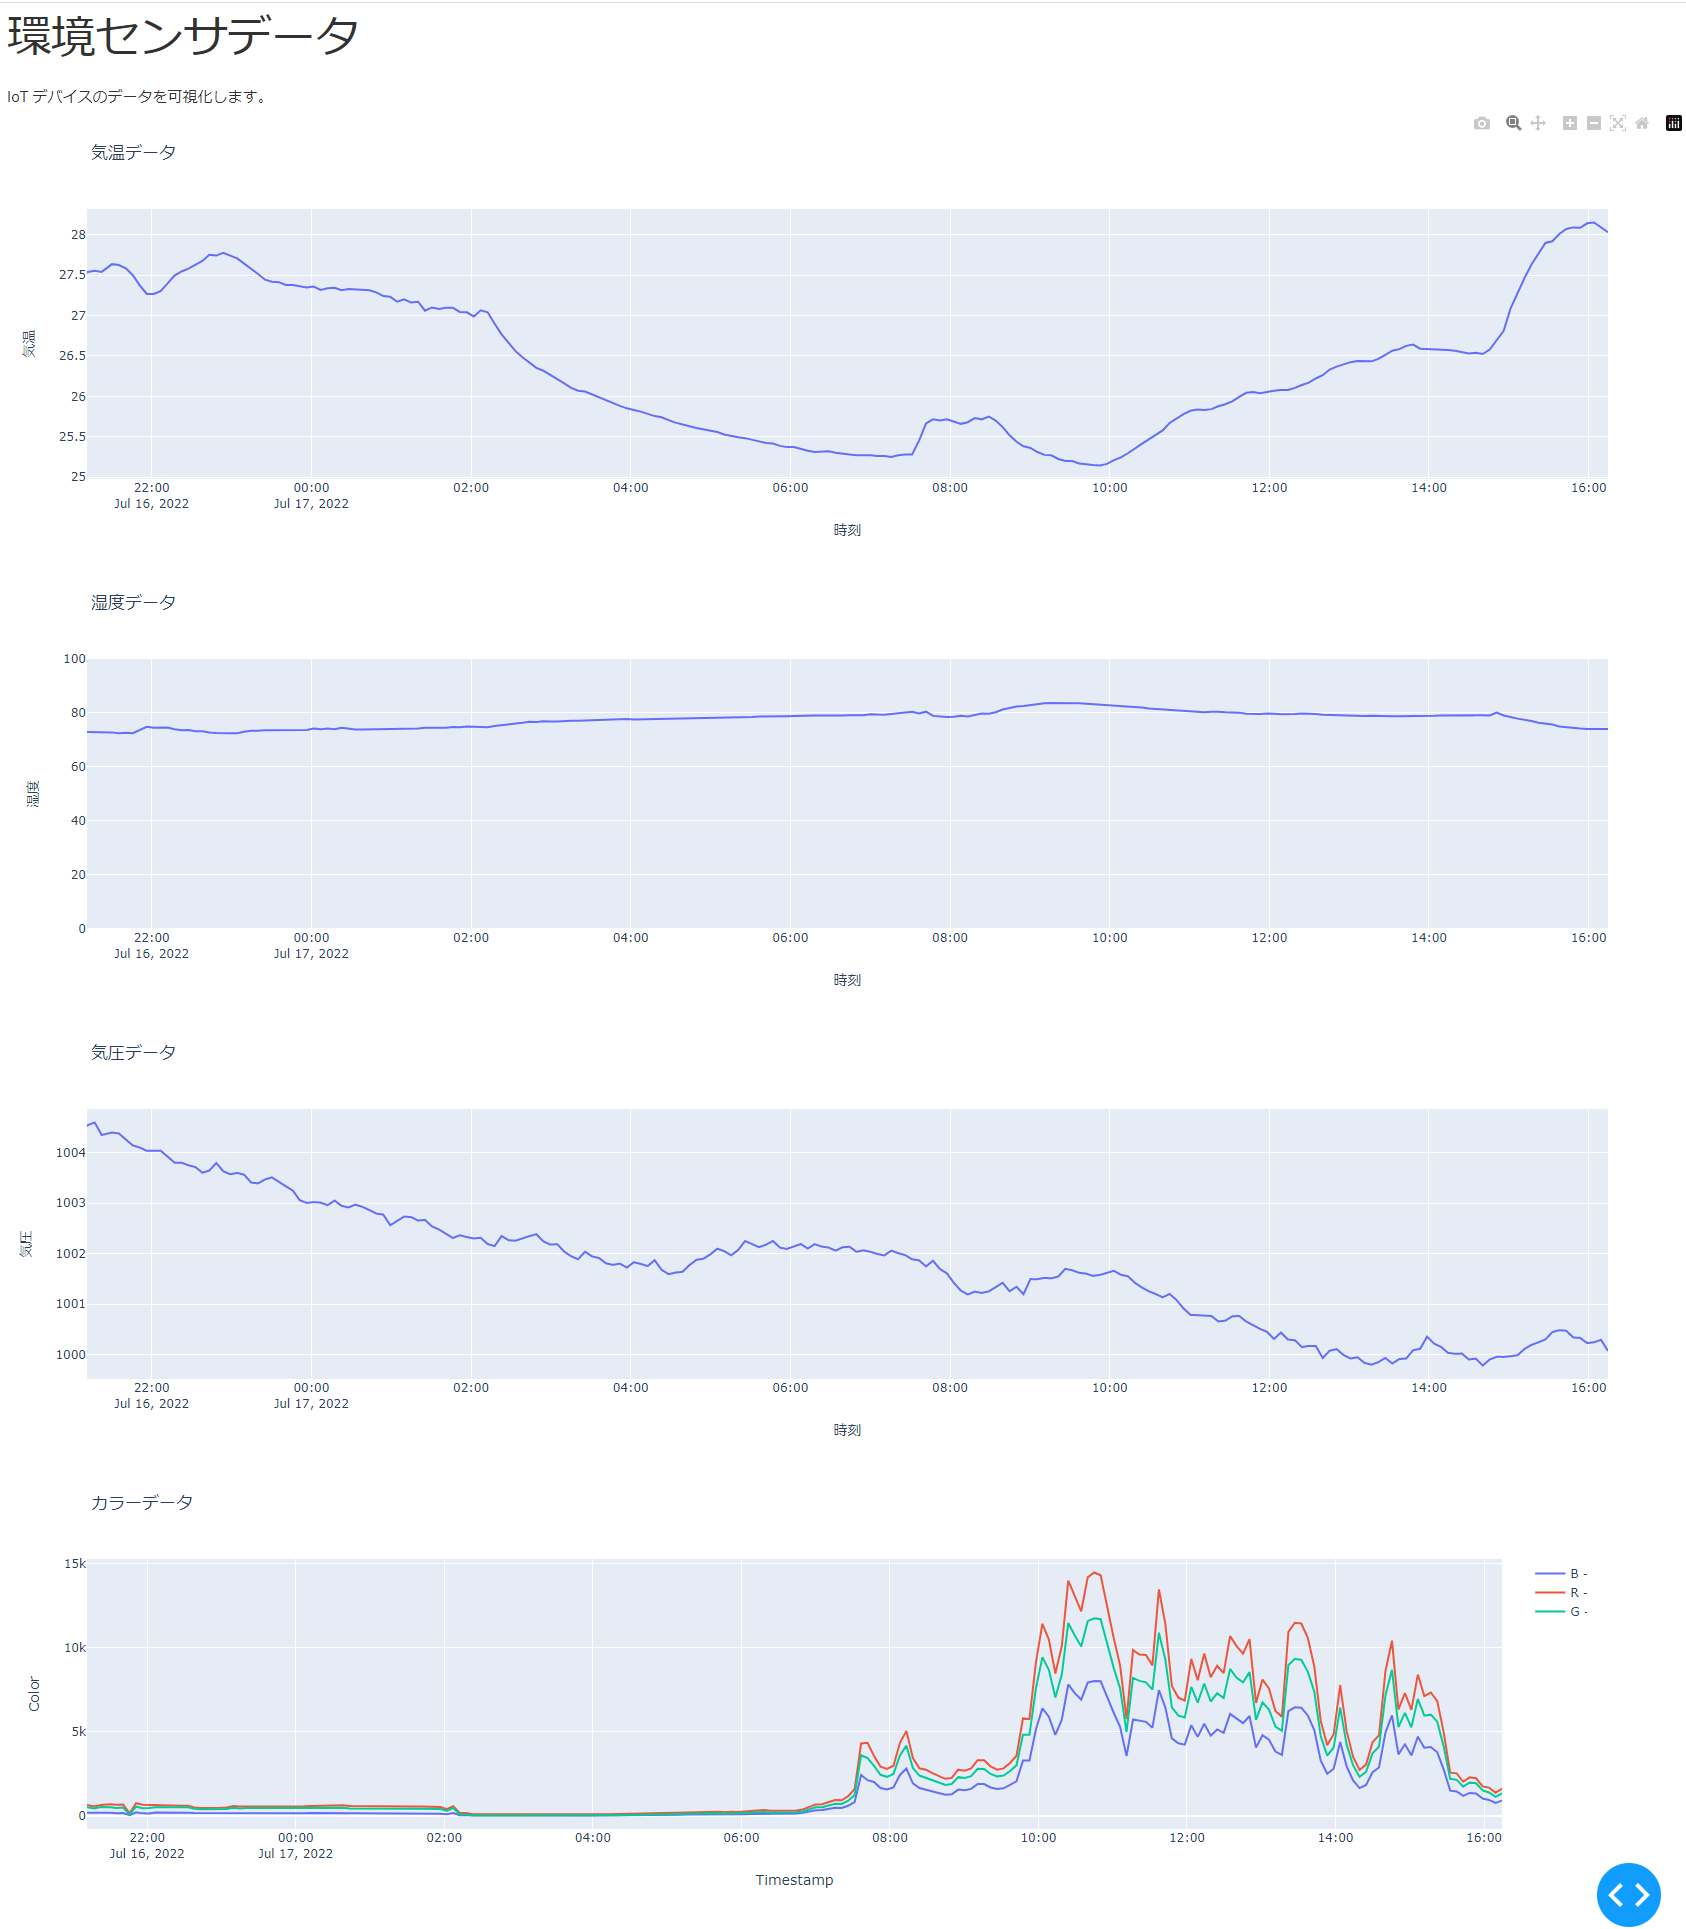
dashがWebサーバーになるので、EC2のパブリックIPアドレスを指定してWebブラウザでアクセスするとグラフが表示されます。
※EC2のセキュリティグループにHTTPのアクセス許可を追加する必要があります。