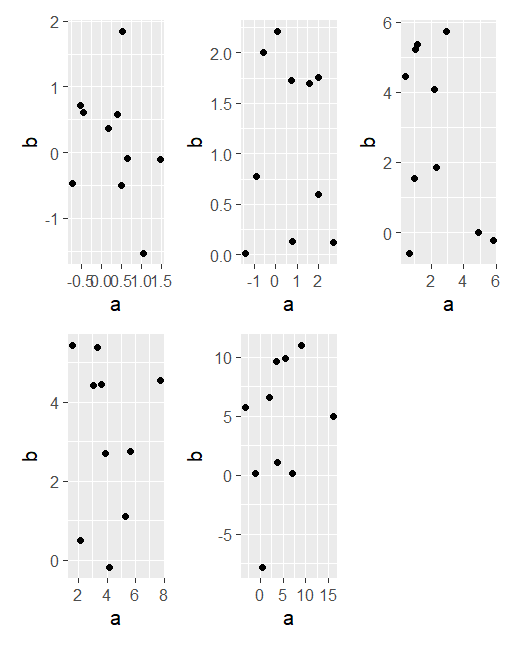
Rの可視化パッケージggplot2で作成された複数のプロットを表示するのに便利なパッケージの一つにpatchworkがあります。各プロットをp1 + p2のように演算子でつなぐだけでまとめて表示ができる便利なパッケージです。
繰り返し処理や関数化では+を1回ずつ書くのが面倒なのでプロットの数に依らずpatchworkでまとめる方法を調べたらreduce()が便利でした。
reduce()を使う
library(patchwork)
library(ggplot2)

# サンプルデータ
d1 <- data.frame(a=rnorm(10),b=rnorm(10))
d2 <- data.frame(a=rnorm(10,1,1),b=rnorm(10,1,1))
d3 <- data.frame(a=rnorm(10,2,2),b=rnorm(10,2,2))
d4 <- data.frame(a=rnorm(10,3,3),b=rnorm(10,3,3))
d5 <- data.frame(a=rnorm(10,4,4),b=rnorm(10,4,4))
# サンプルプロット
p1 <- ggplot(data=d1) + geom_point(aes(x=a,y=b))
p2 <- ggplot(data=d2) + geom_point(aes(x=a,y=b))
p3 <- ggplot(data=d3) + geom_point(aes(x=a,y=b))
p4 <- ggplot(data=d4) + geom_point(aes(x=a,y=b))
p5 <- ggplot(data=d5) + geom_point(aes(x=a,y=b))

# まとめたいプロットをリストにする
p_list.1 <- list(p1, p2)
p_list.2 <- list(p1, p2, p3)
p_list.5 <- list(p1, p2, p3, p4, p5)

# reduceでリストの要素数に関わらずまとめて表示
reduce(p_list.1, `+`)
reduce(p_list.2, `+`)
reduce(p_list.5, `+`)
