レート分布として水以上が強いのはわかるけどあんま参加してない灰色がめちゃくちゃ多いから実際のところどーなのよってのをスクレイピングして参加回数5回以上の参加者のレートを抜き出します。ランキングの表示形式とかが変わったら動かなくなるだろうけどサポートはしません。2019年5月30日現在、このコードは動きます。jupyter想定です。
import urllib.request
l=[]
for r in range(1,311):
    print(r)
    d=urllib.request.urlopen("https://atcoder.jp/ranking?desc=true&orderBy=competitions&page="+str(r)).read().decode('utf-8').replace("	","").split("\n")

    for i in range(len(d)):
        tmp=[]
        if d[i]=="<tr>":
            tmp.append(int(d[i+1].replace(r'<td class="no-break">',"").replace("</td>","")))
            tmp.append(d[i+2].replace("</span></a>","")[-18:].split(">")[-1])
            tmp.append(int(d[i+5].replace("<td><b>","").replace("</b></td>","")))
            tmp.append(int(d[i+6].replace("<td><b>","").replace("</b></td>","")))
            tmp.append(int(d[i+7].replace("<td>","").replace("</td>","")))
            l.append(tmp)
lにランキング、ユーザー名、現在のレート、最高レート、参加回数を入れます。
%matplotlib inline
from numpy import*

df=array(l)
df=df[df[:,-1]>=5]
x=[float("inf"),2800,2400,2000,1600,1200,800,400,0]
current=[]
high=[]
for i in range(len(x)-1):
    current.append(len(df[:,2][ (x[i]> df[:,2]) & (df[:,2] >=x[i+1]) ]))
    high.append(len(df[:,3][ (x[i]> df[:,3]) & (df[:,3] >=x[i+1]) ]))
print(current,high)
レートで振り分けてcurrentとhighに入れます。
赤色から順に
[139, 223, 488, 948, 1947, 2669, 2715, 2647]人
[150, 255, 488, 998, 2028, 2680, 2660, 2517]人
であることが分かりました。
from matplotlib.pyplot import*
pie(current, startangle=90,colors = ["red","orange","yellow","blue","cyan","green","brown","gray"])
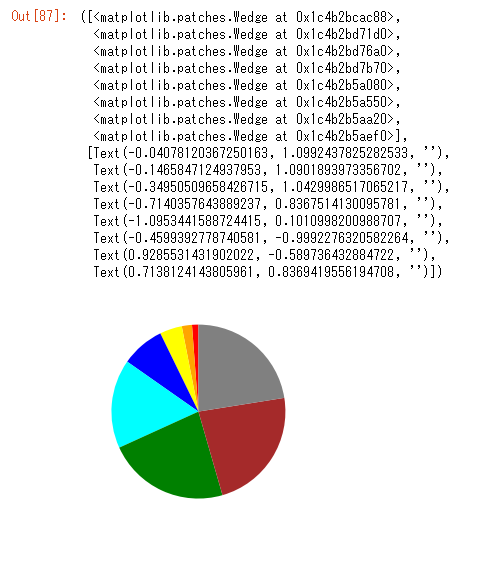
灰、茶、緑、水色で同じような割合で存在するようです。
pie(high, startangle=90,colors = ["red","orange","yellow","blue","cyan","green","brown","gray"])
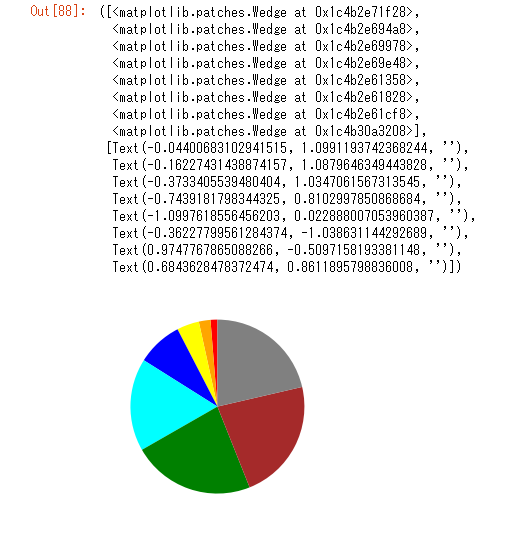
highでもあんまり変わりませんでした。おしまい。