実行環境
Google Colaboratoryで画像を読み込む為の準備
from google.colab import files
from google.colab import drive
drive.mount('/content/drive')
img = cv2.imread("/content/drive/My Drive/Colab Notebooks/img/Lenna.bmp")
img2 = cv2.imread("/content/drive/My Drive/Colab Notebooks/img/Mandrill.bmp")
必要なライブラリの読み込み
import cv2 #opencv
import matplotlib.pyplot as plt
%matplotlib inline
コードの確認
# 新規ウインドウ作成
fig = plt.figure()

# flg全体をX*Yに分割し、plot位置に画像を配置する。
X = 2
Y = 2


# imgの表示
imgplot = 1
ax1 = fig.add_subplot(X, Y, imgplot)
# タイトルの設定
ax1.set_title("img",fontsize=20)
plt.imshow(cv2.cvtColor(img, cv2.COLOR_BGR2RGB))


# img2の表示
img2plot =  4
ax2 = fig.add_subplot(X, Y, img2plot)
# タイトルの設定
ax2.set_title("img2",fontsize=20)
plt.imshow(cv2.cvtColor(img2, cv2.COLOR_BGR2RGB))

plt.show() #なくても表示された。
結果
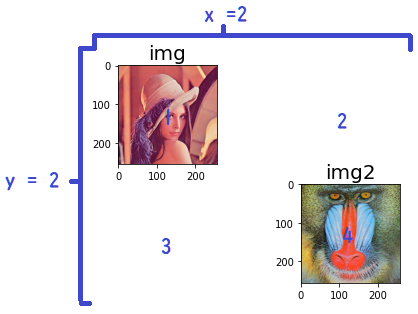
※青色線、青文字はペイントで加筆したもの。
これで、今後の動作結果の比較記事とか書きやすそう!