株式市場全体で値動きを示す代表的な株価指数として例えば日経平均株価があります。
しかし、他指数や個々の銘柄株価は全て日経平均株価の値動きに従うのではなく、
異なる動きをすることがあります。
今回は全体の株価指数と個別銘柄の中間に位置する「業種別株価指数」に着目して
pythonで分析しました。
業種別株価指数を分析しようと考えたのは、個別銘柄の投資に何か参考になるかも、という興味からです。
業種別株価指数は次のような種類があります。
- 東証業種別株価指数
(東証1部に上場している企業を33業種別に分類して、時価総額加重方式により算出される指数) - 業種別日経平均
(日経500種平均株価の500銘柄をベースに36種に分け、日本経済新聞社が算出・公表する株価指数、
指数としては1の方が知られています)
2.業種別日経平均は以下のサイトから簡単にダウンロードできるため、
今回は業種別日経平均に着目して、Google Colaboratoryでpythonを実行しました。
https://indexes.nikkei.co.jp/nkave/index?type=download
まずは、2018年度から2021年7月までの指数の値動きをグラフで可視化しました。
以下コード作成の流れです。
///////////////////////////////////////////////////////////////////////////////////////////////
① 日経500種平均株価と業種別株価指数の時系列データを取得
② matplotlibで可視化
///////////////////////////////////////////////////////////////////////////////////////////////
① 日経500種平均株価と業種別株価指数の時系列データを取得
import pandas as pd
from io import StringIO
import urllib.request
import matplotlib.pyplot as plt

# 日経500種平均株価と業種別平均データを取得
url = "https://indexes.nikkei.co.jp/nkave/historical/nikkei_500_stock_average_daily_jp.csv"
def read_csv(url):
    res = urllib.request.urlopen(url)
    res = res.read().decode('shift_jis')
    df = pd.read_csv(StringIO(res))
    df = df.drop(df.shape[0]-1)
    return df

df = read_csv(url)

df["データ日付"] = pd.to_datetime(df["データ日付"], format='%Y/%m/%d')
df = df.set_index('データ日付')

# 不必要なカラムを削除。今回の指数の値は全て終値で示します。
df = df.drop(['始値', '高値', '安値'], axis=1)
df = df.sort_index(ascending=True)

# 名前の変更
df.rename(columns={'終値':'Nikkei500','業種別(水産)終値':'Fishery', '業種別(鉱業)終値':'Mining', '業種別(建設)終値':'Construction', '業種別(食品)終値':'Foods',\
'業種別(繊維)終値':'Fiber','業種別(パルプ・紙)終値':'Pulp & paper', '業種別(化学)終値':'Chemicals', '業種別(医薬品)終値':'Pharmaceuticals',\
'業種別(石油)終値':'Petroleum','業種別(ゴム)終値':'Rubber', '業種別(窯業)終値':'Glass & Ceramics','業種別(鉄鋼)終値':'Steel','業種別(非鉄・金属)終値':'Nonferrous metals',\
'業種別(機械)終値':'Machinery','業種別(電気機器)終値':'Electric machinery','業種別(造船)終値':'Shipbuilding','業種別(自動車)終値':'Automotive',\
'業種別(輸送用機器)終値':'Transportation instruments','業種別(精密機器)終値':'Precision instruments', '業種別(その他製造)終値':'Other manufacturing','業種別(商社)終値':'Trading companies',\
'業種別(小売業)終値':'Retail','業種別(銀行)終値':'Banking','業種別(その他金融)終値':'Other financial services','業種別(証券)終値':'Securities',\
'業種別(保険)終値':'Insurance','業種別(不動産)終値':'Real estate','業種別(鉄道・バス)終値':'Railway/bus','業種別(陸運)終値':'Land transport',\
'業種別(海運)終値':'Marine transport', '業種別(空運)終値':'Air transport', '業種別(倉庫)終値':'Warehousing', '業種別(通信)終値':'Communications',\
'業種別(電力)終値':'Electric power', '業種別(ガス)終値':'Gas', '業種別(サービス)終値':'Services'}, inplace=True)
② matplotlibで可視化
matplotlibで日経500種の平均株価と各業種(36種)の株価指数を2018年度から2021年7月までの値動きをグラフにしました。
横軸が時間、縦軸が株価指数です。
df.plot(figsize=(30,10),fontsize=8,linewidth=1,layout=(8,8), subplots=True, grid=True, xlabel = 'Date')
plt.show()
以上のようなグラフが得られました。
日経500種の平均株価(Nikkei500、左上端)と比較してざっと見た感じサービス業(Services、右下端)の株価指数のように値動きが似ている業種もありますが、
全く異なる業種もあります。トレンドも各業種により異なっているのが分かります。
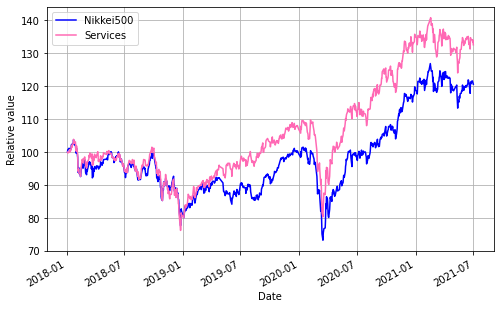
例えば、2018年1月4日を100として日経500種平均株価(Nikkei500)とサービス業(Services)の株価指数を比較したグラフが以下になります。
コードは以下のように作成しました。
df2 = df/df.iloc[0,:]*100
df3 = df2.iloc[:, [0,36]]
df3.plot(figsize=(8,5),fontsize=10, grid=True, color = ['b','hotpink'])
plt.xlabel('Date')
plt.ylabel('Relative value')
plt.show()
株価指数の時系列データを用いて実際に分析し、モデルにフィッティングできればと思い、
後編で行いました。

