先日FluentdMeetup@六本木に出席したのもあり、実環境で実験君しようと思いました。
会社でMaillinglistServerを構築しており、その運用を検討する必要がありました。
ApachelogやMaillog、syslog等のサーバ情報を1か所に集約して、
見たい時に見やすい形でみたい。
まさに、Fluentd+Elasticsearch+Kibanaではないですか。
流行りでもありますし。
そのため、以下のフェーズに分けて実験君開始です。
実験君のフェーズ
- Fluentd+Elasticsearch+Kibanaのサーバ構築
- ローカル環境におけるFluentd動作確認作業(nginxlog)
- サーバ間接続におけるFluentd動作確認作業(apachelog)
- サーバ間接続におけるサーバログの収集(maillog)
- Kibana画面のUI向上とElasticsearchサーバの運用方法
サーバ情報
| No | HOST | CPU | MEM | HDD | OS |
|---|---|---|---|---|---|
| 1 | ElasticsearchServer | 1core | 2.0GB | 13.0GB | CentOS 6.5 |
| 2 | MaillinglistServer | 4core | 2.0GB | 500.0GB | CentOS 6.5 |
Fluentd+Elasticsearch+Kibanaのサーバ構築
※のちのち掲載する予定
ローカル環境におけるFluentd動作確認作業(nginxlog)
まず、以下のような前提で設定してみました。
前提「nginx_log ⇒ file」
①td-agent.confの修正
以下のディレクトリの設定ファイルを修正
# cd /etc/td-agent
# ls
logrotate.d  prelink.conf.d  td-agent.conf  td-agent.conf.tmpl
<match messages>
  type file
  path /var/log/tmp
  time_slice_format %Y%m%d
  time_format %Y%m%dT%H%M%S%z

  # Buffering
  buffer_type memory
  buffer_chunk_limit 8m
  buffer_queue_limit 64
  flush_interval 60s
  retry_wait 1.0
  retry_limit 17
</match>
<source>
  type tail
  path /var/log/nginx/access.log
  format nginx
  pos_file /var/log/td-agent/access.log.pos
  tag messages
</source>
②access.log.posの作成
このファイルがないとtd-agentがどこまでaccess.logを読んだか、
判断がつかなくなるらしいので作成しておく必要がある。
# cd /var/log/td-agent
# touch access.log.pos
# chmod 755 access.log.pos
③/etc/init.d/td-agent reloadにて設定ファイルの読込み
# /etc/init.d/td-agent reload
むむ!ここでまさかのエラー発生です。
Fluentdの動作logを確認してみると権限エラーが発生していることがわかりました。
# cd /var/log/td-agent
# cat td-agent.log
[warn]: temporarily failed to flush the buffer. next_retry=2014-05-14 23:16:40 +0900 error_class="Errno::EACCES" error="Permission denied - /var/log/tmp.log.20140514_0.log" instance=69946227351240
確認してみるとファイル出力先の権限がrootであり、
実行ユーザがtd-agentなので権限不正を起こしていました。
そのため、出力先を権限のあるディレクトリに変更することで
td-agentの設定ファイルの読込みができるようになりました。
# ls -la /var/log/
合計 1424
drwxr-xr-x.  7 root     root       4096  5月 18 04:25 2014 .
drwxr-xr-x. 18 root     root       4096  3月 15 07:37 2014 ..
<match messages>
  type file
  path /var/log/td-agent/tmp
  time_slice_format %Y%m%d
  time_format %Y%m%dT%H%M%S%z

  # Buffering
  buffer_type memory
  buffer_chunk_limit 8m
  buffer_queue_limit 64
  flush_interval 60s
  retry_wait 1.0
  retry_limit 17
</match>
<source>
  type tail
  path /var/log/nginx/access.log
  format nginx
  pos_file /var/log/td-agent/access.log.pos
  tag messages
</source>
④ アクセスログを出力してファイルに出力されたか確認
無事出力されていることを確認しました。第一段階完了となります。
# ls -la
合計 68
drwxr-xr-x. 3 td-agent td-agent  4096  5月 18 18:34 2014 .
drwxr-xr-x. 7 root     root      4096  5月 18 04:25 2014 ..
-rw-r--r--. 1 td-agent td-agent   579  5月 14 23:20 2014 tmp.20140514_0.log
-rw-r--r--. 1 td-agent td-agent  1886  5月 14 23:21 2014 tmp.20140514_1.log
-rw-r--r--. 1 td-agent td-agent   977  5月 14 23:22 2014 tmp.20140514_2.log
-rw-r--r--. 1 td-agent td-agent  1562  5月 14 23:24 2014 tmp.20140514_3.log
-rw-r--r--. 1 td-agent td-agent 15219  5月 15 19:26 2014 tmp.20140515_0.log
# cat tmp.20140514_0.log
20140514T231910+0900	messages	{"remote":"192.168.234.12","host":"-","user":"-","method":"GET","path":"/","code":"304","size":"0","referer":"-","agent":"Mozilla/5.0 (Windows NT 6.1) AppleWebKit/537.36 (KHTML, like Gecko) Chrome/34.0.1847.131 Safari/537.36"}
20140514T231910+0900	messages	{"remote":"192.168.234.12","host":"-","user":"-","method":"GET","path":"/app/dashboards/default.json?1400077147634","code":"200","size":"4140","referer":"http://192.168.234.15/","agent":"Mozilla/5.0 (Windows NT 6.1) AppleWebKit/537.36 (KHTML, like Gecko) Chrome/34.0.1847.131 Safari/537.36"}
前提「nginx_log ⇒ Elasticsearch」
①td-agent.confの修正
以下のディレクトリの設定ファイルを修正します。
前回とは異なり、タグを「access_log」に変更します。
# cd /etc/td-agent
# ls
logrotate.d  prelink.conf.d  td-agent.conf  td-agent.conf.tmpl
<match access_log>
  type elasticsearch
  host localhost
  port 9200
  type_name access_log
  logstash_format true
  logstash_prefix nginx_access
  logstash_dateformat %Y%m

  buffer_type memory
  buffer_chunk_limit 10m
  buffer_queue_limit 10
  flush_interval 1s
  retry_limit 16
  retry_wait 1s
</match>
<source>
  type tail
  path /var/log/nginx/access.log
  format nginx
  pos_file /var/log/td-agent/access.log.pos
  tag access_log
</source>
②/etc/init.d/td-agent reloadにて設定ファイルの読込み
# /etc/init.d/td-agent reload
Reloading td-agent:                                        [  OK  ]
③アクセスログを出力してファイルに出力されたか確認
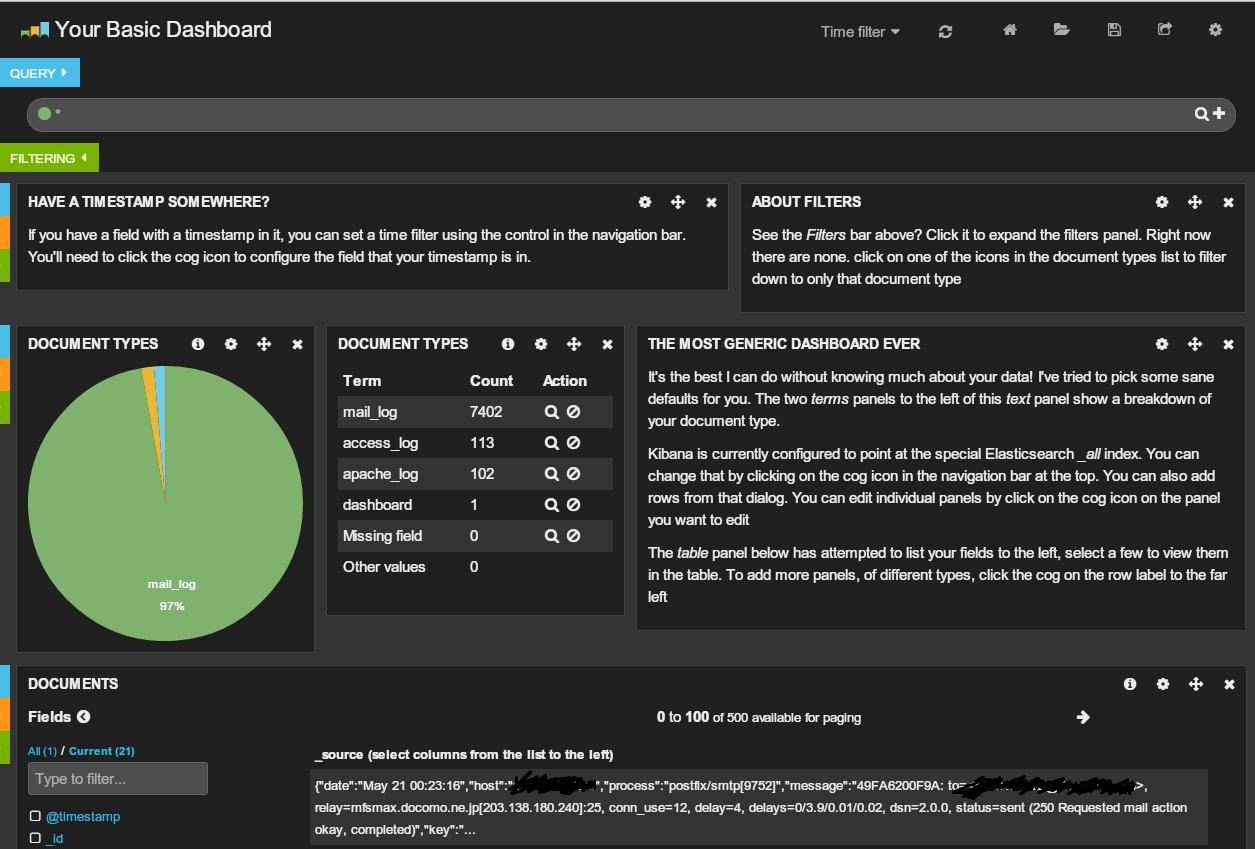
TOP画面
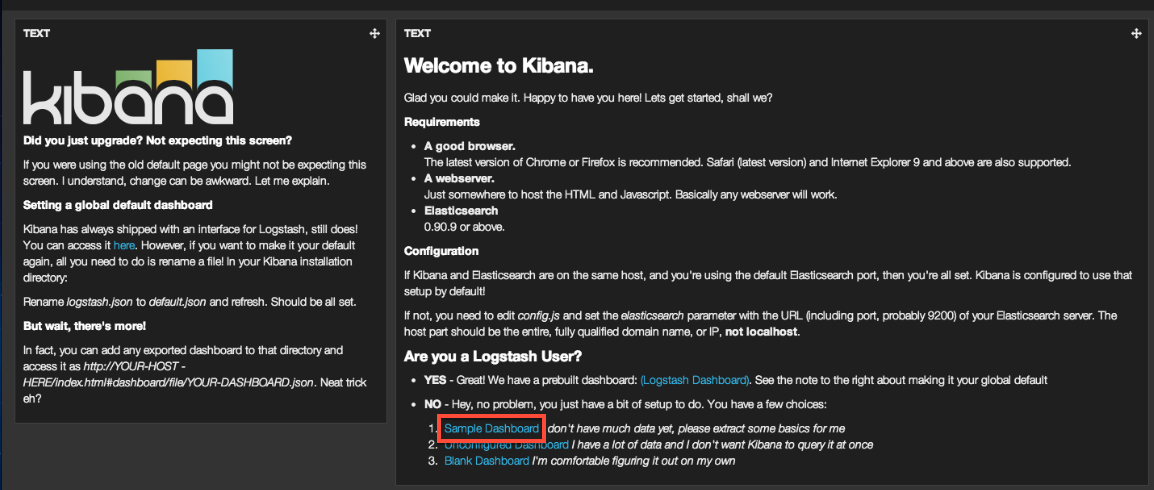
SampleDashboard
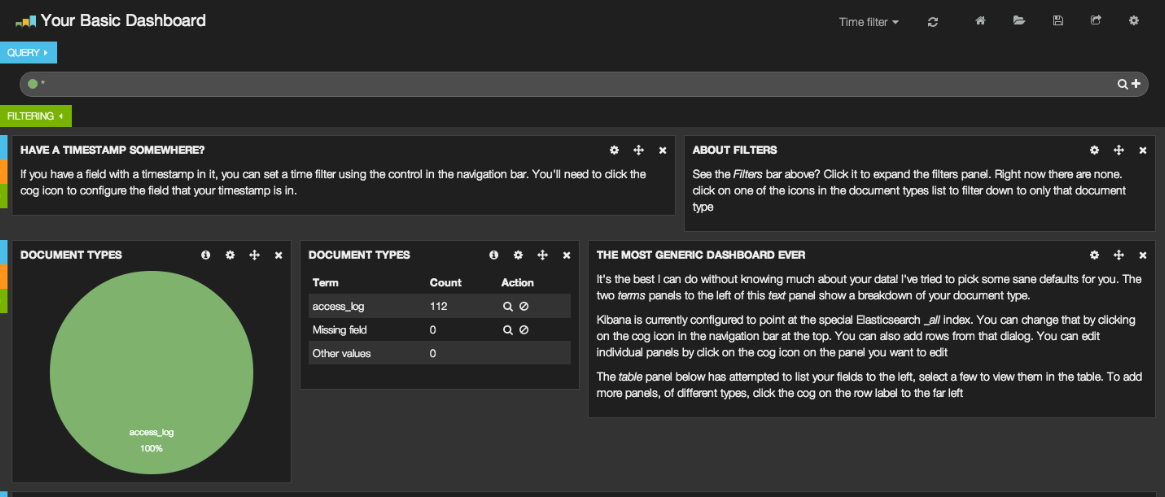
できました。完璧です。
サーバ間接続におけるFluentd動作確認作業(apachelog)
今度はサーバ間の設定を行います。
今までの作業はすべて、ElasticsearchServer側で作業を行いました。
今度の作業は、MaillinglistServer側で設定作業を行うことになります。
MaillinglistServerへのtd-agentのインストールは、
済ませている前提で設定作業を進めていきたいと思います。
前提「(転送元)access_log ⇒ (転送先)Elasticsearch」
①td-agent.confの修正
以下のディレクトリの設定ファイルを修正します。
今度のタグを「apache_log」としてみます。
# cd /etc/td-agent
# ls
logrotate.d  prelink.conf.d  td-agent.conf  td-agent.conf.tmpl
<match apache_log>
  type elasticsearch
  host 192.168.234.15
  port 9200
  type_name apache_log
  logstash_format true
  logstash_prefix apache_access
  logstash_dateformat %Y%m

  buffer_type memory
  buffer_chunk_limit 10m
  buffer_queue_limit 10
  flush_interval 1s
  retry_limit 16
  retry_wait 1s
</match>
<source>
  type tail
  path /var/log/httpd/access_log
  tag apache_log
  pos_file /var/log/td-agent/httpd-access_log.pos
  format apache2
</source>
②httpd-access_log.posの作成
このファイルがないとtd-agentがどこまでaccess.logを読んだか、
判断がつかなくなるらしいので作成しておく必要がある。
# cd /var/log/td-agent
# touch httpd-access_log.pos
# chmod 755 httpd-access_log.pos
③/etc/init.d/td-agent reloadにて設定ファイルの読込み
# /etc/init.d/td-agent reload
うまくいったかと思いきや「ElasticsearchServer」側にログが出力されない。
そのため、エラーログを確認すると以下のように出力されていました。
# cd /var/log/td-agent
# tail -100 td-agent.log

2014-05-19 13:03:51 +0900 [error]: Permission denied - /var/log/httpd/access_log
ログ取得元の権限エラーであることがわかった。
そのため、該当ファイルとディレクトリの権限を変更してみる。
# chmod 755 /var/log/httpd/
# chmod 755 /var/log/httpd/access_log
# ls -la /var/log/httpd/
合計 532
drwxr-xr-x.  2 root root   4096  5月 18 03:45 2014 .
drwxr-xr-x. 12 root root   4096  5月 18 03:45 2014 ..
-rwxrwxrwx   1 root root  15492  5月 19 18:48 2014 access_log
再度、td-agentを再起動してみる。
# /etc/init.d/td-agent restart
td-agentのログを確認してみる。
# cd /var/log/td-agent
# tail -100 td-agent.log

2014-05-19 18:44:18 +0900 [info]: using configuration file: <ROOT>
  <match apache_log>
    type elasticsearch
    host 192.168.234.15
    port 9200
    type_name apache_log
    logstash_format true
    logstash_prefix apache_access
    logstash_dateformat %Y%m
    buffer_type memory
    buffer_chunk_limit 10m
    buffer_queue_limit 10
    flush_interval 1s
    retry_limit 16
    retry_wait 1s
  </match>
  <source>
    type tail
    path /var/log/httpd/access_log
    tag apache_log
    pos_file /var/log/td-agent/httpd-access_log.pos
    format apache2
  </source>
</ROOT>
2014-05-19 18:44:18 +0900 [info]: adding source type="tail"
2014-05-19 18:44:18 +0900 [info]: adding match pattern="apache_log" type="elasticsearch"
2014-05-19 18:44:19 +0900 [info]: following tail of /var/log/httpd/access_log
うむ。うまくいっていそうである。
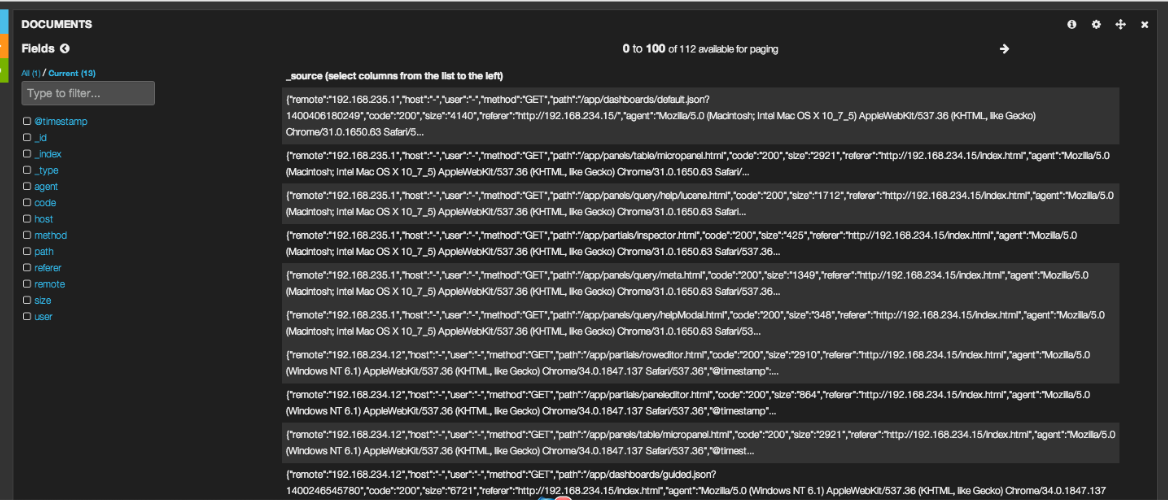
④「ElasticsearchServer」側のKibanaで確認
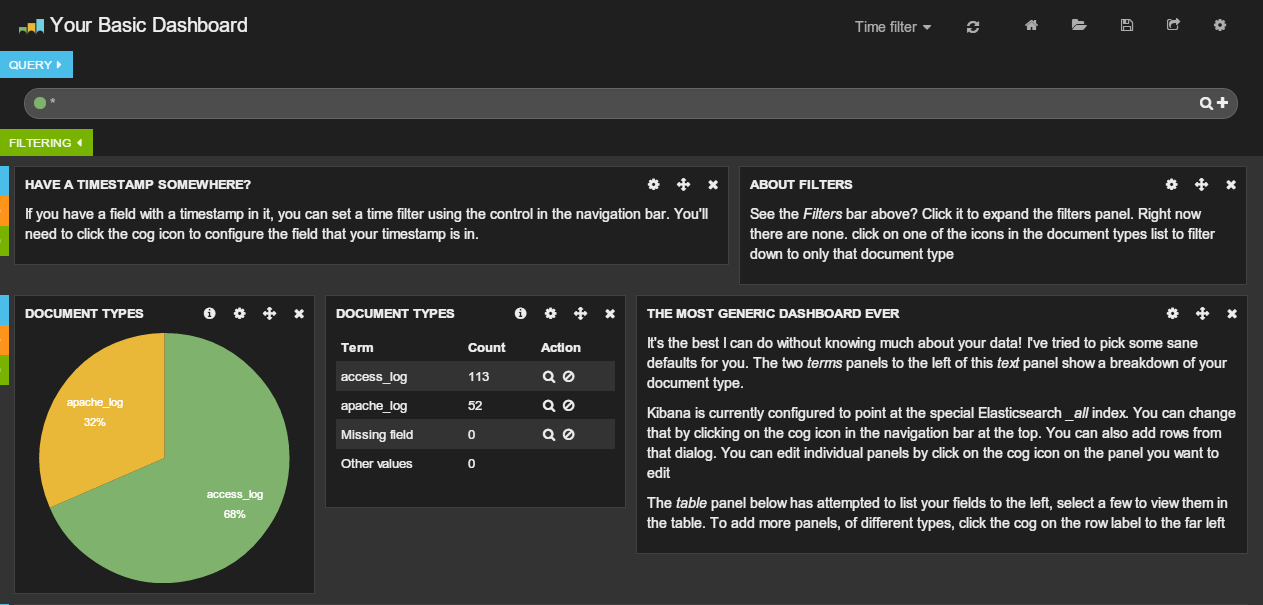
よかった。うまくいっていました。
サーバ間接続におけるサーバログの収集(maillog)
いよいよPostfixのmaillogを入力して、
Elasticsearchへ溜めいくようなシステムが構築できそうです。
まずは、以下の前提から作業を進めていきたいと思います。
前提「(転送元)maillog ⇒ (転送先)Elasticsearch」
①td-agent.confの修正
以下のディレクトリの設定ファイルを修正します。
今度のタグを「mail_log」としてみます。
# cd /etc/td-agent
# ls
logrotate.d  prelink.conf.d  td-agent.conf  td-agent.conf.tmpl
<match apache_log>
  type elasticsearch
  host 192.168.234.15
  port 9200
  type_name apache_log
  logstash_format true
  logstash_prefix apache_access
  logstash_dateformat %Y%m

  buffer_type memory
  buffer_chunk_limit 10m
  buffer_queue_limit 10
  flush_interval 1s
  retry_limit 16
  retry_wait 1s
</match>
<match mail_log>
  type elasticsearch
  host 192.168.234.15
  port 9200
  type_name mail_log
  logstash_format true
  logstash_prefix mail_access
  logstash_dateformat %Y%m

  buffer_type memory
  buffer_chunk_limit 10m
  buffer_queue_limit 10
  flush_interval 1s
  retry_limit 16
  retry_wait 1s
</match>
<source>
  type tail
  path /var/log/httpd/access_log
  tag apache_log
  pos_file /var/log/td-agent/httpd-access_log.pos
  format apache2
</source>
<source>
  type tail
  path /var/log/maillog
  tag mail_log
  pos_file /var/log/td-agent/mailmanmail_log.pos
  format /^(?<date>[^ ]+) (?<host>[^ ]+) (?<process>[^:]+): (?<message>((?<key>[^ :]+)[ :])? ?((to|from)=<(?<address>[^>]+)>)?.*)$/
</source>
②/etc/init.d/td-agent reloadにて設定ファイルの読込み
# /etc/init.d/td-agent reload
むむ!以下の警告メッセージが発生しました。困りました。
と思ったのですが、posファイルを作成し忘れると、
以下のような警告メッセージが出力されるみたいです。
# /etc/init.d/td-agent reload
2014-05-19 19:40:48 +0900 [warn]: 'pos_file PATH' parameter is not set to a 'tail' source.
2014-05-19 19:40:48 +0900 [warn]: this parameter is highly recommended to save the position to resume tailing.
Reloading td-agent:                                        [  OK  ]
そのため、以下にファイルを作成しました。
再読み込みしたらうまくいきました。
# cd /var/log/td-agent
# touch mailmanmail_log.pos
# chmod 755 mailmanmail_log.pos
③読込状況の確認
これで問題ないと思われたのですが、なんと、
Formatが合わずに破棄レコード扱いとされていました。
2014-05-20 16:59:08 +0900 [warn]: pattern not match: "May 20 16:59:08 XXXXXXXXXXXX postfix/smtp[1415]: ACF05200FAE: to=<XXXXXXXXXXXX@XXXXXX.XX.XX>, relay=XXXXXX.XXXXXXXX.XX.XX[XXX.XXX.XXX.XXX]:25, conn_use=23, delay=11, delays=0/11/0.01/0.03, dsn=2.0.0, status=sent (250 Requested mail action okay, completed)"
フォーマットが合わないので、正規表現を見直す必要がありそう。
インターネットを参考にして正規表現でフォーマットをこしらえましたが、
他にも取得しておきたい情報があるので、ここからは勉強が必要そうです。
ここでいろいろフォーマットについて、熱心に取り組んでいる方がいたので
そのサイトを参考に進めることにしてみました。
http://blog.glidenote.com/blog/2012/07/15/fluentd-regex-debug/
http://d.hatena.ne.jp/tagomoris/20120715/1342368392
こんな便利なサイトもあるのですね。
さっそく直して試行錯誤を繰り替えてして出来ました。
<match apache_log>
  type elasticsearch
  host 192.168.234.15
  port 9200
  type_name apache_log
  logstash_format true
  logstash_prefix apache_access
  logstash_dateformat %Y%m

  buffer_type memory
  buffer_chunk_limit 10m
  buffer_queue_limit 10
  flush_interval 1s
  retry_limit 16
  retry_wait 1s
</match>
<match mail_log>
  type elasticsearch
  host 192.168.234.15
  port 9200
  type_name mail_log
  logstash_format true
  logstash_prefix mail_access
  logstash_dateformat %Y%m

  buffer_type memory
  buffer_chunk_limit 10m
  buffer_queue_limit 10
  flush_interval 1s
  retry_limit 16
  retry_wait 1s
</match>
<source>
  type tail
  path /var/log/httpd/access_log
  tag apache_log
  pos_file /var/log/td-agent/httpd-access_log.pos
  format apache2
</source>
<source>
  type tail
  path /var/log/maillog
  tag mail_log
  pos_file /var/log/td-agent/mailmanmail_log.pos
  format /^(?<date>\w{3} \d\d (\d{2}:){2}\d{2}) (?<host>[^ ]+) (?<process>[^:]+): (?<message>((?<key>[^ :]+)[ :])? ?((to|from)=<(?<address>[^>]+)>)?.*)$/
</source>
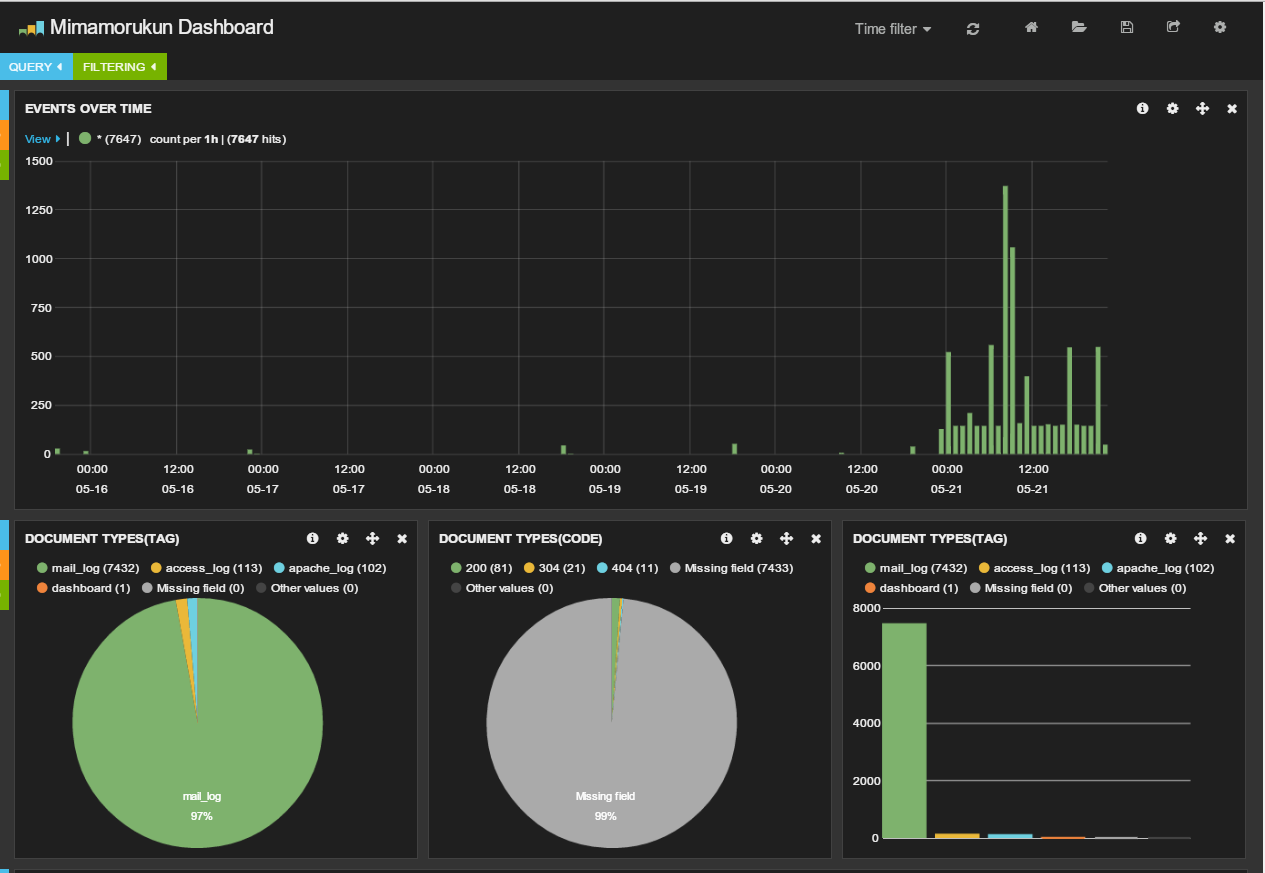
こんな感じでKinabaでmail_logが見れるようになりました。
Kibana画面のUI向上とElasticsearchサーバの運用方法
Kibanaのカスタマイズについては、以下のサイトが参考になりました。
とても助かりました。ありがとうございます。
それで少しいじってみた画面がこちらです。
いじってみたわかったのですが、不要なドキュメントが大量に蓄積されたり、
検索したいフィールドがなかったりして、思うようにできませんでした。
たとえば、以下のような検索や表示ができると嬉しい。
・送信OK。送信NG。送信遅延の件数。
・多くメールを送っている人ランキング(FROM)。
・多くメールを貰っている人ランキング(TO)。
・ドメイン別メール件数。
これは、どのドキュメントを蓄積し、どのフィールドを検索したいか。
要件をある程度想定した上で、FluentdのFormatを作成する必要があると感じました。
今後はこの部分に着目して、より使いやすい、
Fluentd+Elasticsearch+Kibanaを目指して
いろいろいじっていきたいと思います。