1. 条件付き確率
■ 問題文
1 から 3 の目が赤色で塗られており、
4 から 6 の目は青色で塗られているサイコロがある。
このサイコロを投げて青色の目が出た時、
出た目が偶数である 確率 を求めよ。
■ 解答
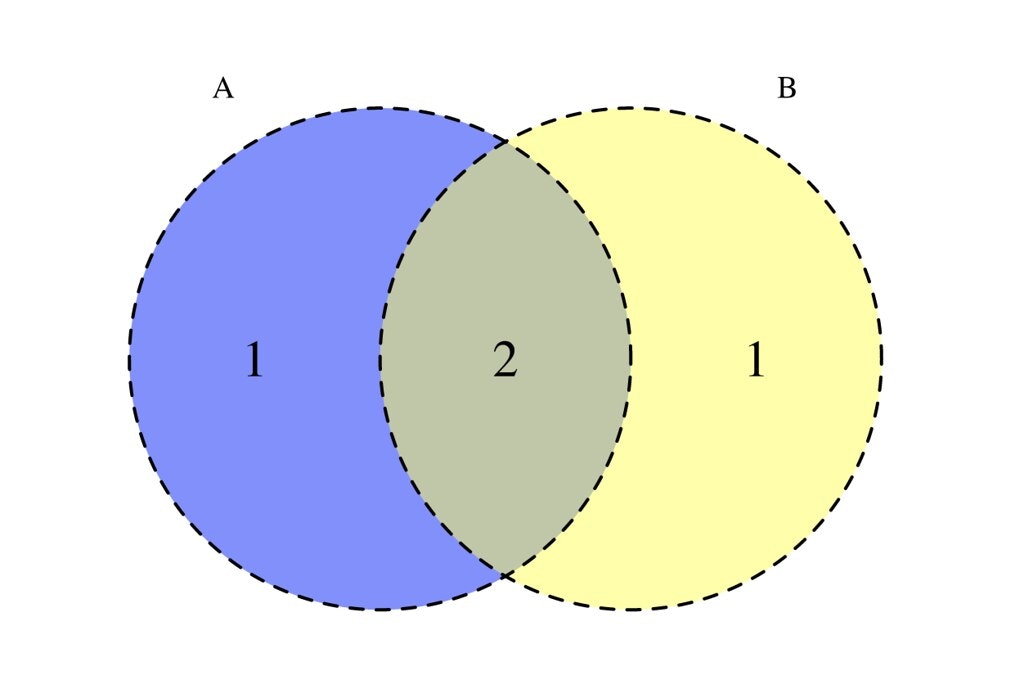
青色の目が出る 事象 を
A
偶数の目が出る 事象 をB
とすると、青色の目が偶数の 確率 はP(B|A)
P(B|A)の確率は、P(A ∩ B) / P(A)
# P(A ∩ B) を P(A) で除算 → P(B|A)
> U <- c(1,2,3,4,5,6) # 全事象
> A <- c(4,5,6) # 青色
> B <- c(2,4,6) # 偶数
> length(A) / length(U)
[1] 0.5 # P(A) ≈ 1/2
> length(intersect(A,B)) / length(U)
[1] 0.3333333 # P(A ∪ B) ≈ 1/3
> (length(intersect(A,B)) / length(U)) / (length(A) / length(U))
[1] 0.6666667 # P(B|A) ≈ 2/3
install.packages("VennDiagram", repos="http://cran.ism.ac.jp/")
library(VennDiagram)
A <- c(4,5,6) # 青色
B <- c(2,4,6) # 偶数
data <- list(A=A,B=B)
venn.diagram(data, filename="conditional_probability_01.svg", imagetype="svg", height=5, width=5, fill=c(4,7), lty=2, scaled=F, cex=c(2,2,2), cat.pos=c(330,30), cat.dist=c(0.05,0.05), cat.cex=c(1.2,1.2))
2. 二項分布
■ 問題文
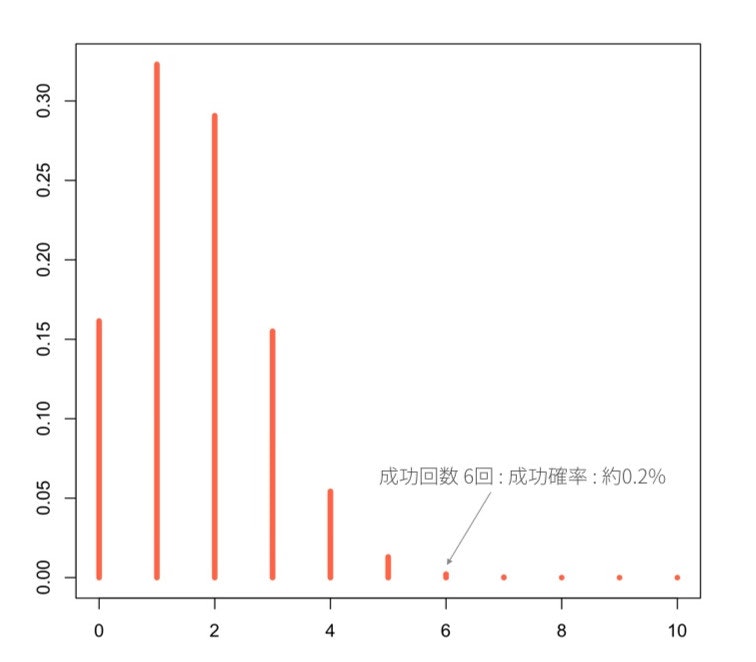
サイコロを 10 回振るとき、6 の目が 6 回出る 確率 を求めよ。
■ 解答
二項分布 を用いて算出する。
6 の目が出る 確率 は 1/6 のため、
6 の目が出る回数をxとすると、
xはB(10, 1/6)に従う。
# dbinom(成功回数, 試行回数, 成功確率)
> dbinom(6, 10, 1/6)
[1] 0.002170635 # 約0.2%
x<-0:10
plot(x,dbinom(x,10,1/6), type="h", lwd=5, col="tomato1", cex.lab=1, cex.main=1.7)
http://www.r-fiddle.org/#/fiddle?id=bYmsIshk
3. 正規分布の再現性
■ 問題文
日本人男性2人をランダムに選んで肩車をしてもらった時、
身長はどのような分布となるか求めよ。
ただし、日本人男性の肩までの身長は 正規分布N(140cm, 20)、
座高は 正規分布N(100cm, 10)に従うとし、
肩車した時の身長は肩までの身長 + 座高で計算できるものとする。
■ 解答
上側の男性の座高を
X、下側の男性の肩までの身長をYとすると、
肩車全体の身長は、X + Yの分布に従います。
XとYはどちらも 正規分布 に従うことから、
X + Yもまた 正規分布 に従います。
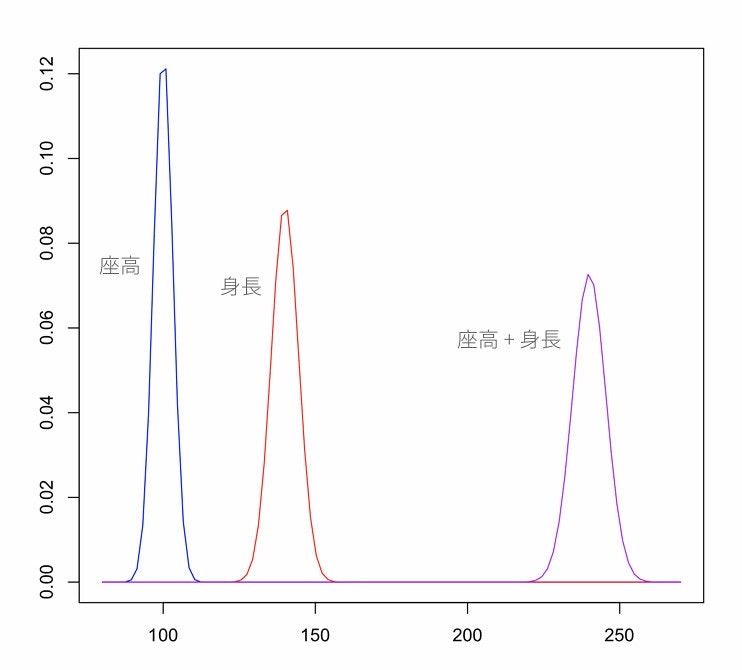
> # 座高 : 平均100cmと分散10の正規分布 - N(100, 10)
> curve(dnorm(x, 100, sqrt(10)), 80, 270, col="blue")
> # 肩までの身長 : 平均140cmと分散20の正規分布 - N(140, 20)
> curve(dnorm(x, 140, sqrt(20)), 80, 270, col="red", add=TRUE)
> # 座高 + 肩までの身長 : 平均240cm(100cm + 140cm)と分散30(10 + 20)の正規分布 - N(240, 30)
> curve(dnorm(x, 240, sqrt(30)), 80, 270, col="purple", add=TRUE)
http://www.r-fiddle.org/#/fiddle?id=YJnBukwh
4. 標準正規分布
■ 問題 A
確率変数
Zが 標準正規分布N(0, 1)に従うとき、
Zが 2 以上となる 確率P(Z ≥ 2)を求めよ。
■ 解答 A
z値 ( 観測統計量 と 母平均 の差 ) から、
上側確率 を求めます。
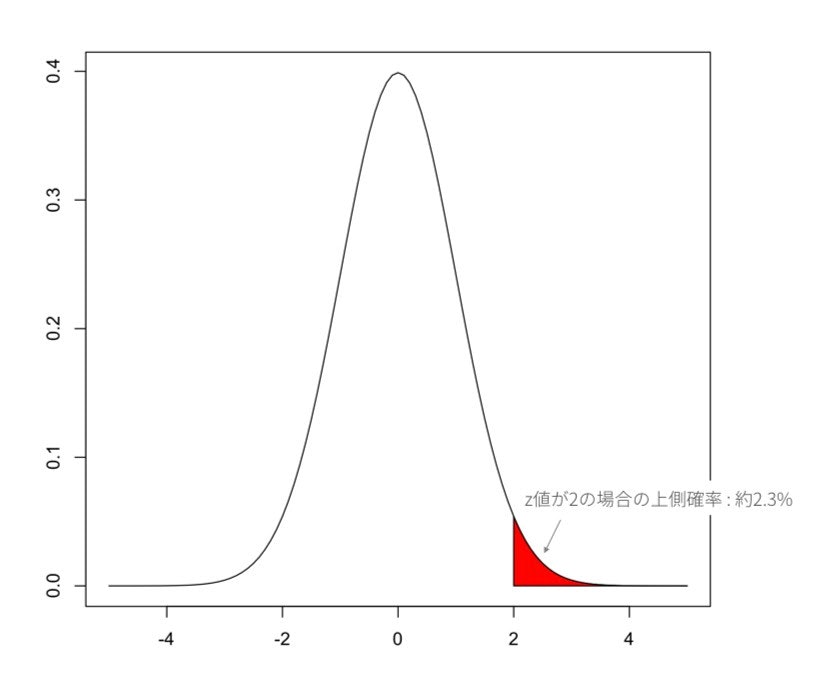
# z 値が 2 の場合の上側確率を算出する
> pnorm(2, lower.tail=F)
[1] 0.02275013 # → 約 2.3%
# z 値が 2 の場合の上側確率を赤色にする
curve( dnorm(x, mean=0, sd=1), from=-5, to=5 )
n  <- 100
xs <- seq(2, 5, length=n)
ys <- dnorm(xs, mean=0, sd=1)
polygon(c(xs, rev(xs)), c(rep(0,n), rev(ys)), col="red")
http://www.r-fiddle.org/#/fiddle?id=v4J6xaVe
■ 問題 B
確率変数
Zが 標準正規分布N(0, 1)に従うとき、
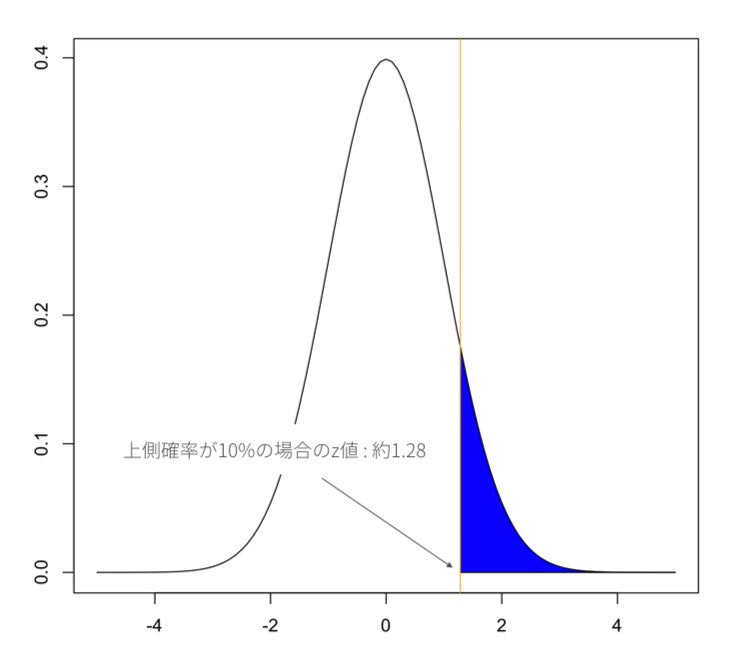
Zがz以上となる 確率P(Z ≧ z)が 10% となるようなzを求めよ
■ 解答 B
上側確率 から、
z値 ( 観測統計量 と 母平均 の差 ) を求めます。
# 上側確率が 10% の場合の z 値を算出する
> qnorm(0.1, lower.tail=F)
[1] 1.281552 # → 約 1.28
# 上側確率 10% を青色にし、z 値にオレンジ色の垂線を引く
curve( dnorm(x, mean=0, sd=1), from=-5, to=5 )
z  <- qnorm(0.1, lower.tail=F)
n  <- 100
xs <- seq(z, 5, length=n)
ys <- dnorm(xs, mean=0, sd=1)
polygon(c(xs, rev(xs)), c(rep(0,n), rev(ys)), col="blue")
abline(v = z, col="orange")
http://www.r-fiddle.org/#/fiddle?id=pMTXKQgu
