Introduction
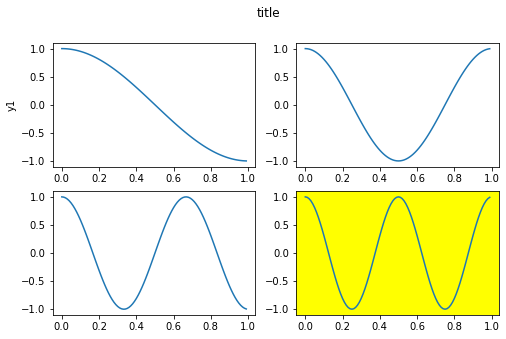
Pythonの可視化ライブラリの代表格であるMatplotlibを使えば複数のグラフを並べることなど容易である.
ただし記述方法がいくつかありいつもこんがらがるので整理してみた.
ライブラリインポート
import matplotlib.pyplot as plt
import numpy as np
データ準備
x = np.arange(0,1,0.01)
y1 = np.cos(np.pi*x)
y2 = np.cos(2*np.pi*x)
y3 = np.cos(3*np.pi*x)
y4 = np.cos(4*np.pi*x)
パターン1:subplot()
fig = plt.figure(figsize=(8,5))
fig.suptitle('title')

plt.subplot(2,2,1)
plt.plot(x,y1)
plt.ylabel('y1')

plt.subplot(2,2,2)
plt.plot(x,y2)

plt.subplot(2,2,3)
plt.plot(x,y3)

plt.subplot(2,2,4, facecolor='yellow')
plt.plot(x,y4)
パターン2:figure(), add_subplot()
fig = plt.figure(figsize=(8,5))
fig.suptitle('title')

ax1 = fig.add_subplot(2,2,1)
ax1.plot(x,y1)
ax1.set_ylabel('y1')

ax2 = fig.add_subplot(2,2,2)
ax2.plot(x,y2)

ax2 = fig.add_subplot(2,2,3)
ax2.plot(x,y3)

ax2 = fig.add_subplot(2,2,4)
ax2.plot(x,y4)
ax2.set_facecolor('yellow')
パターン3:subplots()
fig, ax = plt.subplots(2,2,figsize=(8,5))
fig.suptitle('title')

ax[0,0].plot(x,y1)
ax[0,0].set_ylabel('y1')

ax[0,1].plot(x,y2)

ax[1,0].plot(x,y3)

ax[1,1].plot(x,y4)
ax[1,1].set_facecolor('yellow')
Conclusion
3パターンの記述方法を紹介した.
個人的にはコードがすっきりし,グラフの場所が分かりやすいパターン3が好み.
