Introduction
summarytoolsパッケージ内のdfSummaryを使ってデータ概要を可視化する方法について解説.
パッケージインストールとインポート
# ! pip install summarytools
from summarytools.summarytools import dfSummary
import pandas as pd
import seaborn as sns
データの準備
今回は,seaborn内のタイタニックデータを使用.
data = sns.load_dataset('titanic')
data.head()
データ概要の可視化
dfSummaryでデータ概要を可視化
引数の詳細
- data:データフレーム
- max_level = 10:カテゴリー変数の表示数
- show_graph = True:グラフ表示の有無
- tmp_dir = './tmp':画像のディレクトリ
- is_collapsible = False:ページ折り畳みの有無
個人的には,1)画像は保存しない,2)ページは折りたたむ;以下のスタイルがおすすめ
dfSummary(data, tmp_dir = '', is_collapsible = True)
dfSummary(data)
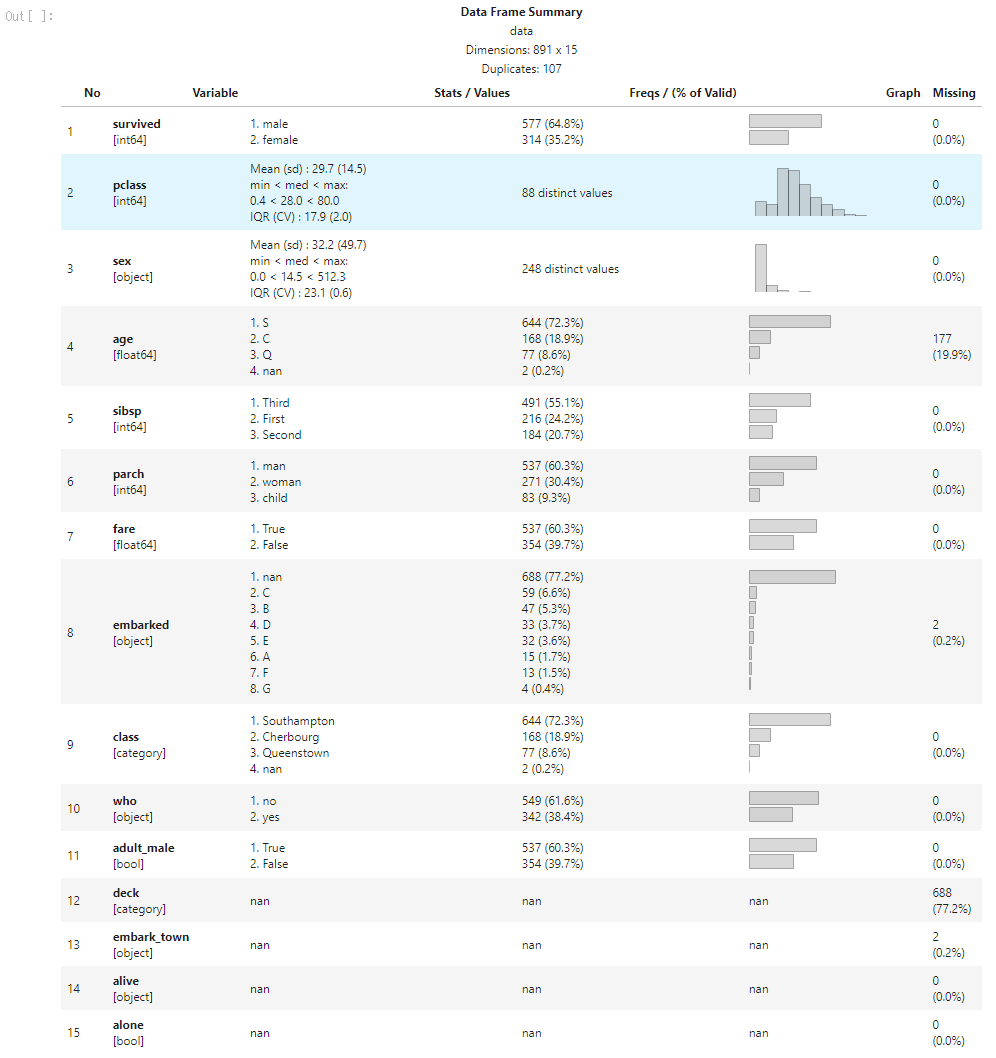
実行してみると,自分の環境ではint64型の列がうまく表示されない現象が起きた.
この理由が分かる人は,是非ともコメントで教えてほしい.
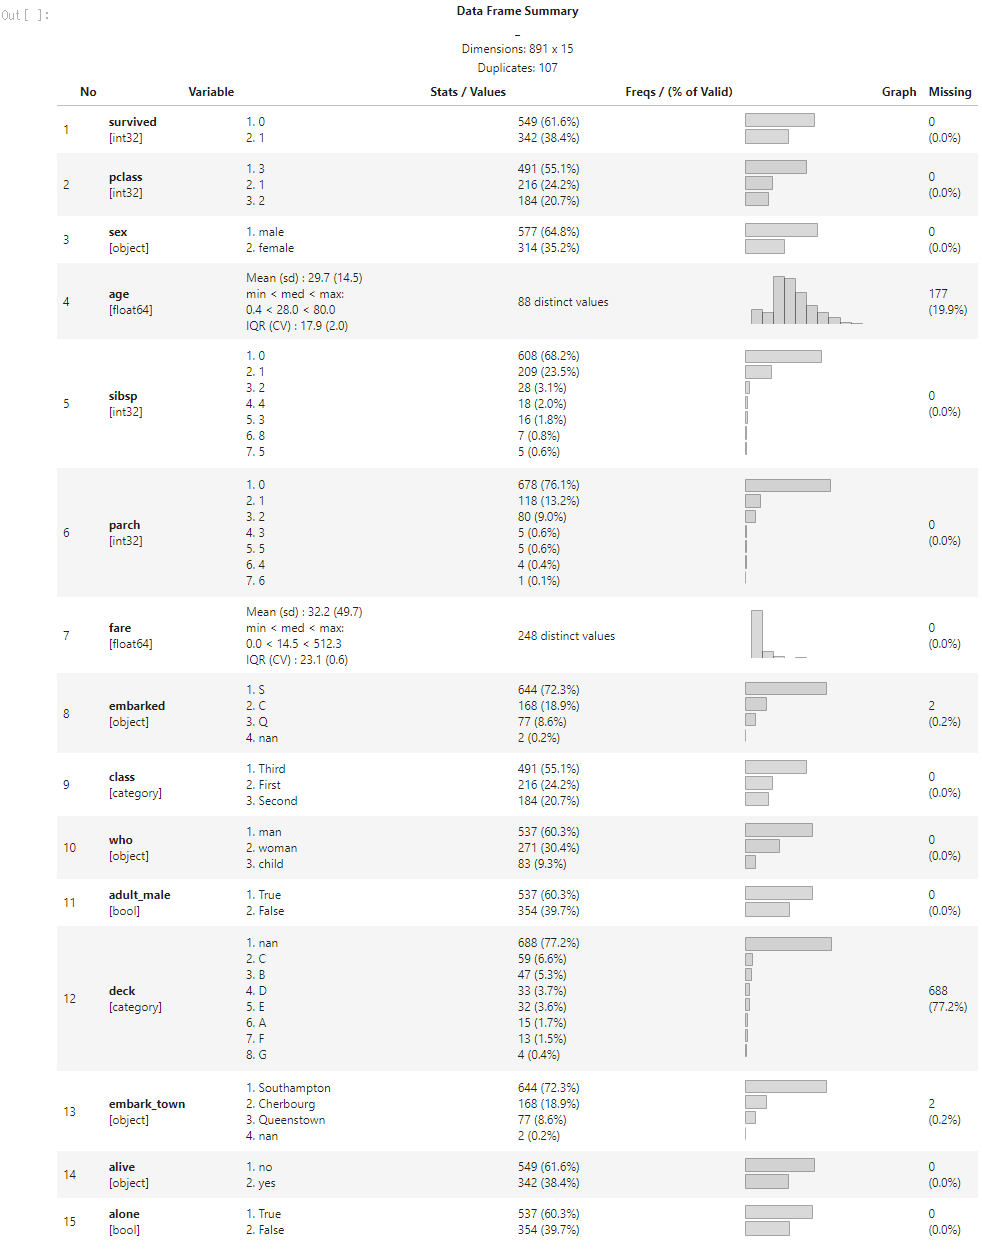
とりあえずint64型の列を一度int32型に変換したら改善した.
col_int = data.select_dtypes(include='int64').columns
data[col_int] = data[col_int].astype(int)
dfSummary(data)
Conclusion
dfSummaryはとりあえずデータの概要を把握したいときに,非常に簡単に使える関数なので活用されたし.
code
# パッケージインストールとインポート
# ! pip install summarytools
from summarytools.summarytools import dfSummary
import pandas as pd
import seaborn as sns

# データの準備
data = sns.load_dataset('titanic')
data.head()

# データ概要の可視化
col_int = data.select_dtypes(include='int64').columns
data[col_int] = data[col_int].astype(int)
dfSummary(data)


