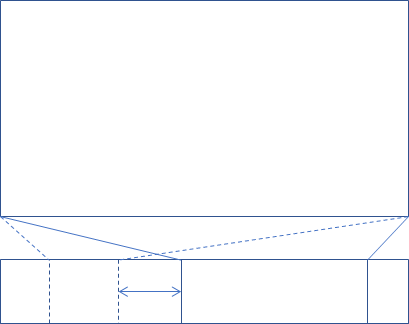
d3.jsを使って選択された範囲のグラフを表示させる
使用するデータは乱数で生成した株価っぽいやつ。特に意味はない。
ソースコード
デモページ
svg領域への出力範囲(値域)は変えず、入力範囲(定義域)を変化させることで、グラフの拡大縮小・移動を行う。

処理フロー
- 範囲選択を始める
- 選択範囲から逆算して、元のサイズでの選択された範囲($1)を求める
- $1を入力範囲として、スケール変換用の関数($2)を生成する
- $2でデータを変換し、プロットする
グラフの描画
グラフ描画はいいって人は範囲選択へ
データ変換(スケール変換関数)
d3.scaleLinear()はデータの入力範囲と出力範囲を決めるだけで線形変換を行う関数(一次関数)を作成してくれる。
domain()が入力範囲でrange()が出力範囲。
中学数学に即して言えば、domainがxの変域、rangeがyの変域。
でも入力する数値はdomain()で定義した範囲内の数値でなくても問題はない。
const scale = d3.scaleLinear()
  .range([0, 100])
  .domain([0, 10]);  // y = 10x が作られる。

console.log(scale(-10)); // -100が出力される。
出力範囲をsvg領域内に設定する。sub領域は全データを表示させるために入力範囲を全データに設定する。
main領域のdomainは初期値を便宜上全データに設定している。
let mainScale = d3.scaleLinear()
    .domain([0, data.length])
    .range([0, width]);
const subScale = d3.scaleLinear()
    .domain([0, data.length])
    .range([0, width]);
描画
グラフを描画するための関数を設定する。
const mainLine = d3.line()
    .x((d) => {
        return mainScale(d[0]);
    })
    .y((d) => {
        return d[1];
    });
const subLine = d3.line()
    .x((d) => {
        return subScale(d[0]);
    })
    .y((d) => {
        return subScale(d[1]);
    });
グラフを描画する
main.append("path")
    .datum(data)
    .attr("d", mainLine);

sub.append("path")
    .datum(data)
    .attr("d", subLine);
範囲選択
brushを作成する
.extent( [ 座標1 , 座標2 ] )で選択可能範囲を指定している。
const brush = d3.brushX()
    .extent([[0, 0], [width, subHeight]]);
brushイベントの作成と追加
ここが要点
処理フローの2~4をやっている。
scale.invertはscale関数の逆関数。
d3.event.selectionで選択された範囲を持ってきて、map.(subScale.invert)で元のサイズでの選択範囲を取得している。
で、取得した選択範囲をmainScale.domainに適用している。
main.select.attr("d",mainLine)はグラフの更新。
mainLineの中で更新したmainScaleを使ってる。
const brushed = () => {
    mainScale.domain(d3.event && d3.event.selection ? d3.event.selection.map(subScale.invert) : subScale.domain());
    main.select("path").attr("d", mainLine);
};

brush.on("brush", brushed);
brushを追加する
公式のAPIでもbrush用のgタグをappendして、そのgタグの中にbrushを追加している。mustです。
const brushes = sub.append("g");
brushes.call(brush);
使用した外部関数
export const createData = (min, max, n, a) => {
    if (a === undefined) a = 0;
    let data = [];

    data.push([0, random(min, max)]);
    for (let i = 1; i < n; i++) {
        let Max = Math.min(max, data[i - 1][1] + a);
        let Min = Math.max(min, data[i - 1][1] - a);
        data.push([i, random(Min, Max)]);
    }
    return data;
}

const random = (min, max) => {
    if (min >= max) new Error();
    return Math.random() * (max - min) + min;
}