実行環境
・windows 10 Pro 64bit
・Python3.6.3
cProfile モジュール
cProfile ライブラリを使用するとモジュール内のオーバーヘッドを確認できる。
サンプルコード
julia_set.py
import time

# グローバル定数
x1, x2, y1, y2 = -1.8, 1.8, -1.8, 1.8
c_real, c_imag = -0.62772, -0.42193


def calc_pure_python(desired_width, max_iterations):
    x_step = (float(x2 - x1) / float(desired_width))
    y_step = (float(y1 - y2) / float(desired_width))
    x = []
    y = []
    ycoord = y2
    while ycoord > y1:
        y.append(ycoord)
        ycoord += y_step
    xcoord = x1
    while xcoord < x2:
        x.append(xcoord)
        xcoord += x_step

    # 座標リストを作り、各点を初期条件にする
    zs = []
    cs = []
    for ycoord in y:
        for xcoord in x:
            zs.append(complex(xcoord, ycoord))
            cs.append(complex(c_real, c_imag))

    print('Length of x: ', len(x))
    print('Total elements: ', len(zs))
    start_time = time.time()
    output = calculate_z_serial_purepython(max_iterations, zs, cs)
    end_time = time.time()
    secs = end_time - start_time
    print(f'{ calculate_z_serial_purepython.__name__ } took { secs } seconds')

    # 固定値 1000~2のグリッドを、繰り返し上限300回としたときの値
    # 正当性チェック
    assert sum(output) == 33219980


# CPU バウンドの計算関数
def calculate_z_serial_purepython(maxiter, zs, cs):
    """
    ジュリア漸化式を使用して output リストを計算する
    """
    output = [0] * len(zs)
    for i in range(len(zs)):
        n = 0
        z = zs[i]
        c = cs[i]
        while abs(z) < 2 and n < maxiter:
            z = z * z + c
            n += 1

        output[i] = n

    return output


if __name__ == '__main__':
    # ジュリア集合を計算する
    calc_pure_python(desired_width=1000, max_iterations=300)
コマンド実行
$ python -m cProfile -s cumulative julia_set.py

Length of x:  1000
Total elements:  1000000
calculate_z_serial_purepython took 23.838048934936523 seconds
         36221995 function calls in 25.485 seconds

   Ordered by: cumulative time

   ncalls  tottime  percall  cumtime  percall filename:lineno(function)
        1    0.000    0.000   25.485   25.485 {built-in method builtins.exec}
        1    0.060    0.060   25.485   25.485 julia_set.py:1(<module>)
        1    1.270    1.270   25.425   25.425 julia_set.py:8(calc_pure_python)
        1   16.907   16.907   23.839   23.839 julia_set.py:44(calculate_z_serial_purepython)
 34219980    6.932    0.000    6.932    0.000 {built-in method builtins.abs}
  2002000    0.300    0.000    0.300    0.000 {method 'append' of 'list' objects}
        1    0.015    0.015    0.015    0.015 {built-in method builtins.sum}
        3    0.001    0.000    0.001    0.000 {built-in method builtins.print}
        2    0.000    0.000    0.000    0.000 {built-in method time.time}
        4    0.000    0.000    0.000    0.000 {built-in method builtins.len}
        1    0.000    0.000    0.000    0.000 {method 'disable' of '_lsprof.Profiler' objects}


(以下略)
②profile.stats オプションを使用することで profile.stats ファイルを生成できる。
起動コマンド
# profile.stats → ファイル名
$ python -m cProfile -o profile.stats julia_set.py
profile.stats はPythonで読み込むことができる。
$ python
>>> import pstats
>>> p = pstats.Stats('profile.stats')
>>> p.sort_stats('cumulative')
>>> <pstats.Stats object at 0x00000299728D9278>
>>> p.print_stats()
Mon Jul 16 08:44:00 2018    profile.stats

         36221995 function calls in 29.504 seconds

   Ordered by: cumulative time

   ncalls  tottime  percall  cumtime  percall filename:lineno(function)
        1    0.000    0.000   29.504   29.504 {built-in method builtins.exec}
        1    0.062    0.062   29.504   29.504 julia_set.py:1(<module>)
        1    1.272    1.272   29.442   29.442 julia_set.py:8(calc_pure_python)
        1   19.520   19.520   27.850   27.850 julia_set.py:44(calculate_z_serial_purepython)
 34219980    8.331    0.000    8.331    0.000 {built-in method builtins.abs}
  2002000    0.299    0.000    0.299    0.000 {method 'append' of 'list' objects}
        1    0.021    0.021    0.021    0.021 {built-in method builtins.sum}
        3    0.001    0.000    0.001    0.000 {built-in method builtins.print}
        2    0.000    0.000    0.000    0.000 {built-in method time.time}
        4    0.000    0.000    0.000    0.000 {built-in method builtins.len}
        1    0.000    0.000    0.000    0.000 {method 'disable' of '_lsprof.Profiler' objects}


<pstats.Stats object at 0x000001FA58817588>
profile.stats から呼び出し側の情報を表示することもできる。
print_callers() 関数を使用することで呼び出し元を特定できるので、コストの高い呼び出し元を絞り込むことができる。
> p.print_callers()
   Ordered by: cumulative time

Function                                                                                   was called by...
                                                                                               ncalls  tottime  cumtime
{built-in method builtins.exec}                                                            <-
before_julia_set_1.py:4(<module>)                                                          <-       1    0.051   27.094  {built-in method builtins.exec}
before_julia_set_1.py:24(calc_pure_python)                                                 <-       1    1.218   27.044  before_julia_set_1.py:4(<module>)
before_julia_set_1.py:14(measure_time)                                                     <-       1    0.000   25.514  before_julia_set_1.py:24(calc_pure_python)
before_julia_set_1.py:64(calculate_z_serial_purepython)                                    <-       1   18.297   25.514  before_julia_set_1.py:14(measure_time)
{built-in method builtins.abs}                                                             <- 34219980    7.217    7.217  before_julia_set_1.py:64(calculate_z_serial_purepython)
{method 'append' of 'list' objects}                                                        <- 2002000    0.296    0.296  before_julia_set_1.py:24(calc_pure_python)
{built-in method builtins.sum}                                                             <-       1    0.015    0.015  before_julia_set_1.py:24(calc_pure_python)
{built-in method builtins.print}                                                           <-       1    0.000    0.000  before_julia_set_1.py:14(measure_time)
                                                                                                    3    0.000    0.000  before_julia_set_1.py:24(calc_pure_python)
before_julia_set_1.py:13(timefn)                                                           <-       1    0.000    0.000  before_julia_set_1.py:4(<module>)
C:\Users\kento\AppData\Local\Programs\Python\Python36\lib\functools.py:44(update_wrapper)  <-       1    0.000    0.000  before_julia_set_1.py:13(timefn)
{built-in method time.time}                                                                <-       2    0.000    0.000  before_julia_set_1.py:14(measure_time)
                                                                                                    2    0.000    0.000  before_julia_set_1.py:24(calc_pure_python)
<frozen importlib._bootstrap>:997(_handle_fromlist)                                        <-       1    0.000    0.000  before_julia_set_1.py:4(<module>)
{built-in method builtins.len}                                                             <-       2    0.000    0.000  before_julia_set_1.py:24(calc_pure_python)
                                                                                                    2    0.000    0.000  before_julia_set_1.py:64(calculate_z_serial_purepython)
{built-in method builtins.getattr}                                                         <-       7    0.000    0.000  C:\Users\kento\AppData\Local\Programs\Python\Python36\lib\functools.py:44(update_wrap
per)

以下略
print_callees() 関数を使用することでどの関数を呼び出しているのかを表示できる。
>>> p.print_callees()
   Ordered by: cumulative time

Function                                          was called by...
                                                      ncalls  tottime  cumtime
{built-in method builtins.exec}                   <-
julia_set.py:1(<module>)                          <-       1    0.062   29.504  {built-in method builtins.exec}
julia_set.py:8(calc_pure_python)                  <-       1    1.272   29.442  julia_set.py:1(<module>)
julia_set.py:44(calculate_z_serial_purepython)    <-       1   19.520   27.850  julia_set.py:8(calc_pure_python)
{built-in method builtins.abs}                    <- 34219980    8.331    8.331  julia_set.py:44(calculate_z_serial_purepython)
{method 'append' of 'list' objects}               <- 2002000    0.299    0.299  julia_set.py:8(calc_pure_python)
{built-in method builtins.sum}                    <-       1    0.021    0.021  julia_set.py:8(calc_pure_python)
{built-in method builtins.print}                  <-       3    0.001    0.001  julia_set.py:8(calc_pure_python)
{built-in method time.time}                       <-       2    0.000    0.000  julia_set.py:8(calc_pure_python)
{built-in method builtins.len}                    <-       2    0.000    0.000  julia_set.py:8(calc_pure_python)
                                                           2    0.000    0.000  julia_set.py:44(calculate_z_serial_purepython)
{method 'disable' of '_lsprof.Profiler' objects}  <-


<pstats.Stats object at 0x000001FA58817588>
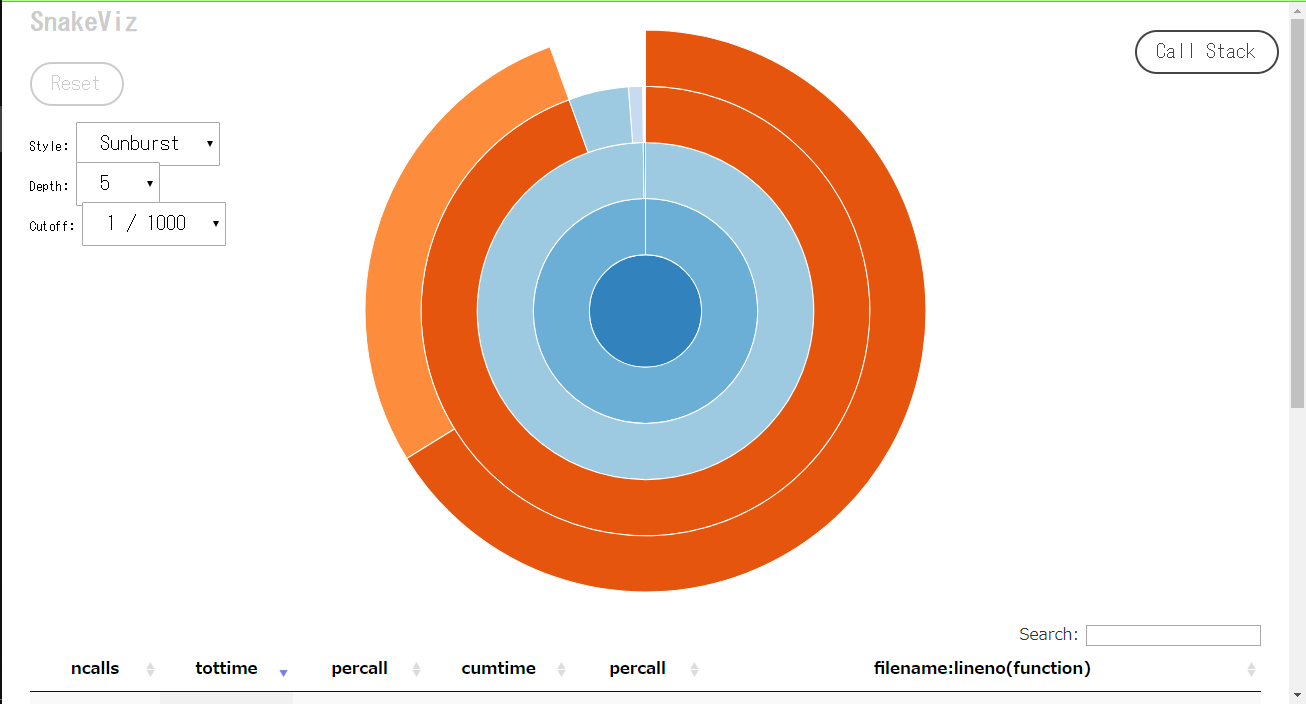
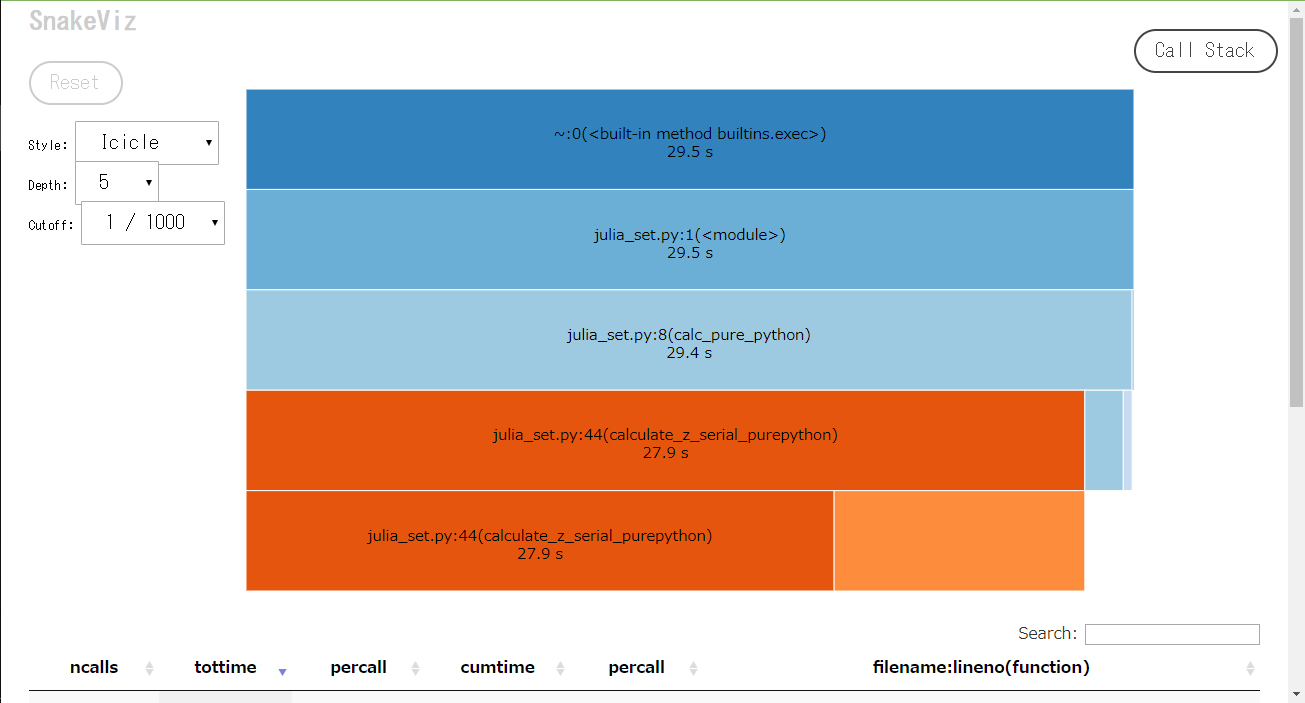
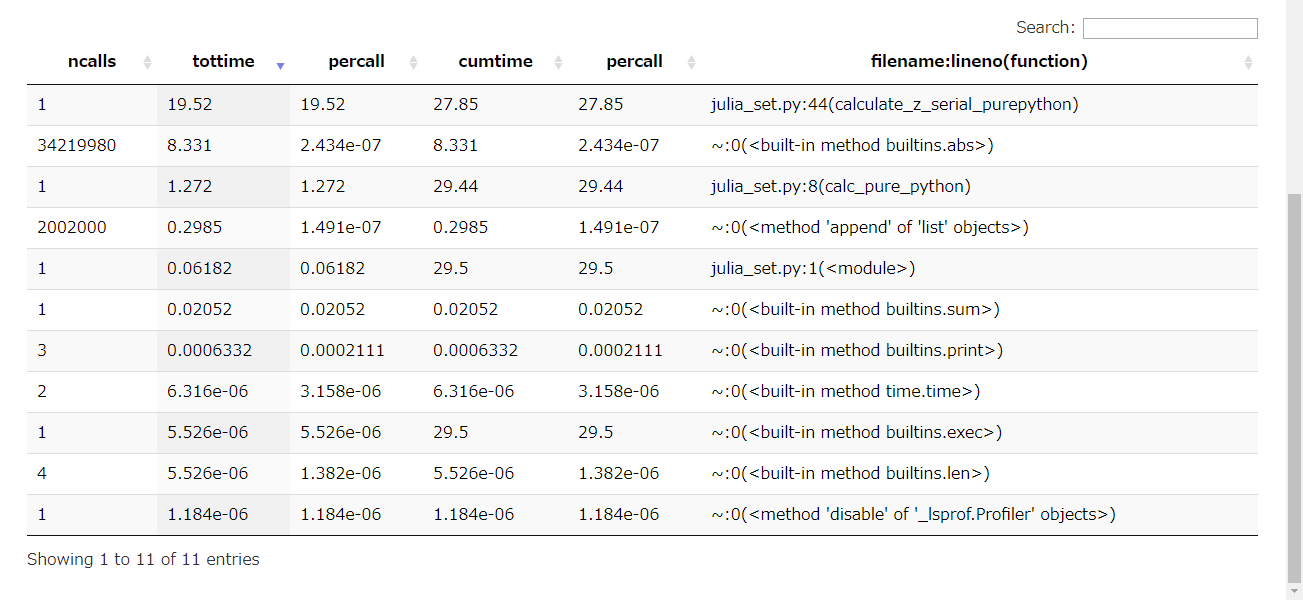
snakeviz モジュール
snakeviz を使用すると、cProfile の出力した統計結果を視覚化できる。図を見るだけでコストの高い関数が一目でわかる。
インストール
$ pip install snakeviz
コマンド実行
# profile.stats → ファイル名
$ snakeviz profile.stats
以下、実行時の参考画像
line_profiler モジュール
line_profiler を使用すると各関数を行単位で計測するので、チューニングが必要は行の特定ができる。
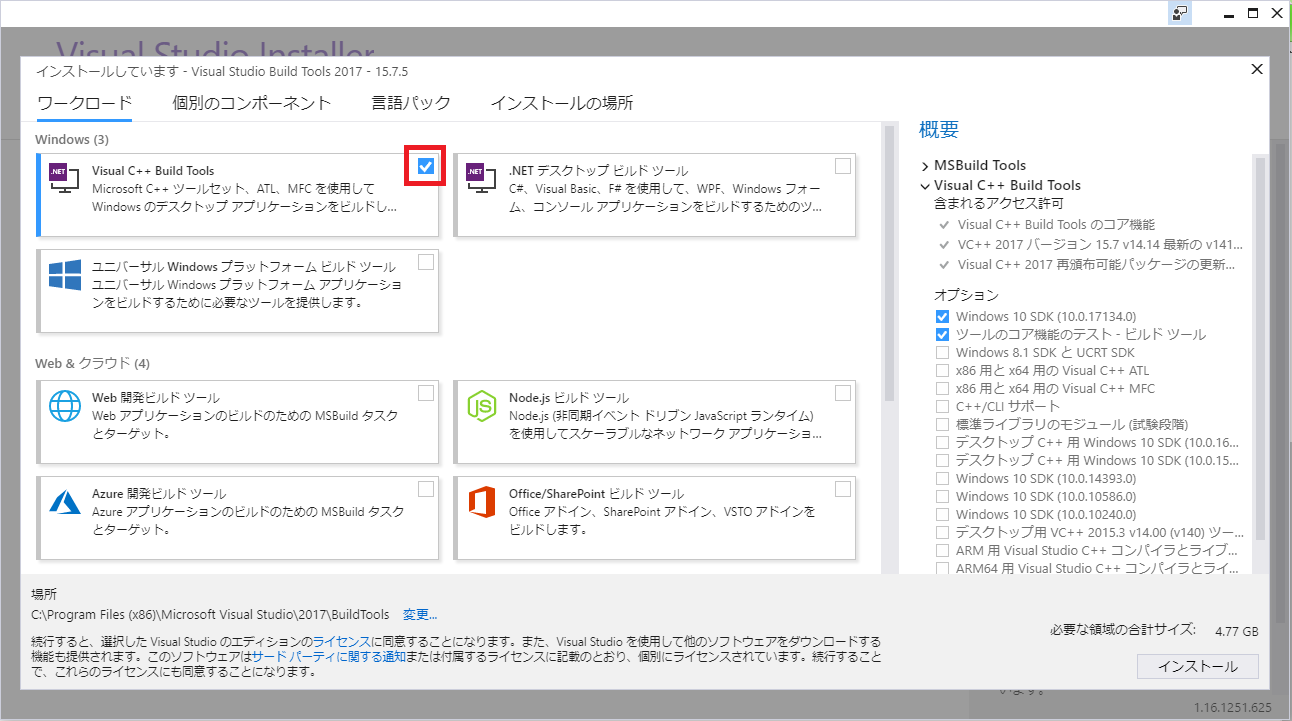
コンパイラのインストール
コンパイラが必要になるので以下のURLから取得してインストールする。
https://www.visualstudio.com/ja/downloads
「Build Tools for Visual Studio 2017」 をダウンロード

実行ファイル起動後、「Visual C++ Build Tools」にチェックをつけてインストール
# エラーが出るがインストールはできる。
$ pip install line_profiler
$ git clone https://github.com/rkern/line_profiler.git
line_profiler 実行前に対象モジュールの関数に @profile を付与する。
julia_set.py
import time

# グローバル定数
x1, x2, y1, y2 = -1.8, 1.8, -1.8, 1.8
c_real, c_imag = -0.62772, -0.42193


def calc_pure_python(desired_width, max_iterations):
    x_step = (float(x2 - x1) / float(desired_width))
    y_step = (float(y1 - y2) / float(desired_width))
    x = []
    y = []
    ycoord = y2
    while ycoord > y1:
        y.append(ycoord)
        ycoord += y_step
    xcoord = x1
    while xcoord < x2:
        x.append(xcoord)
        xcoord += x_step

    # 座標リストを作り、各点を初期条件にする
    zs = []
    cs = []
    for ycoord in y:
        for xcoord in x:
            zs.append(complex(xcoord, ycoord))
            cs.append(complex(c_real, c_imag))

    print('Length of x: ', len(x))
    print('Total elements: ', len(zs))
    start_time = time.time()
    output = calculate_z_serial_purepython(max_iterations, zs, cs)
    end_time = time.time()
    secs = end_time - start_time
    print(f'{ calculate_z_serial_purepython.__name__ } took { secs } seconds')

    # 固定値 1000~2のグリッドを、繰り返し上限300回としたときの値
    # 正当性チェック
    assert sum(output) == 33219980


# CPU バウンドの計算関数
# ↓ に @profileを追加して line_profilerの計測対象にする
@profile
def calculate_z_serial_purepython(maxiter, zs, cs):
    """
    ジュリア漸化式を使用して output リストを計算する
    """
    output = [0] * len(zs)
    for i in range(len(zs)):
        n = 0
        z = zs[i]
        c = cs[i]
        while abs(z) < 2 and n < maxiter:
            z = z * z + c
            n += 1

        output[i] = n

    return output


if __name__ == '__main__':
    # ジュリア集合を計算する
    calc_pure_python(desired_width=1000, max_iterations=300)
コマンド実行
$ python line_profiler/kernprof.py -l -v julia_set.py
Length of x:  1000
Total elements:  1000000
calculate_z_serial_purepython took 277.837988615036 seconds
Wrote profile results to julia_set.py.lprof
Timer unit: 3.9474e-07 s

Total time: 173.619 s
File: julia_set.py
Function: calculate_z_serial_purepython at line 45

Line #      Hits         Time  Per Hit   % Time  Line Contents
==============================================================
    45                                           @profile
    46                                           def calculate_z_serial_purepython(maxiter, zs, cs):
    47                                               """
    48                                               ジュリア漸化式を使用して output リストを計算する
    49                                               """
    50         1      18915.0  18915.0      0.0      output = [0] * len(zs)
    51   1000001    2707922.0      2.7      0.6      for i in range(len(zs)):
    52   1000000    2632718.0      2.6      0.6          n = 0
    53   1000000    3088312.0      3.1      0.7          z = zs[i]
    54   1000000    2982926.0      3.0      0.7          c = cs[i]
    55  34219980  177968268.0      5.2     40.5          while abs(z) < 2 and n < maxiter:
    56  33219980  142884632.0      4.3     32.5              z = z * z + c
    57  33219980  104282683.0      3.1     23.7              n += 1
    58
    59   1000000    3264717.0      3.3      0.7          output[i] = n
    60
    61         1          5.0      5.0      0.0      return output