How To Place Legend Inside the Plot area in Altair
この記事について
最近はpandas/dataframeと相性がいいAltairが気にいって使っています。
しかし、凡例の位置はmatplotlibだとプロット内に表示されるのに、Altairだと外になってしまい、位置の調節の仕方が分かりませんでした。英語でもなかなか資料が見つからなかったのですが、AltairがパースしているVega-Liteのドキュメントなどをみて解決しましたので、記事にします。
非常に参考にさせていただいた、こちらのサイトよりIrisのデータのグラフにて説明したいと思います。
[Altairのすすめ!Pythonによるデータの可視化]
(https://qiita.com/dr666m1/items/b71bef31ba3a21868095)
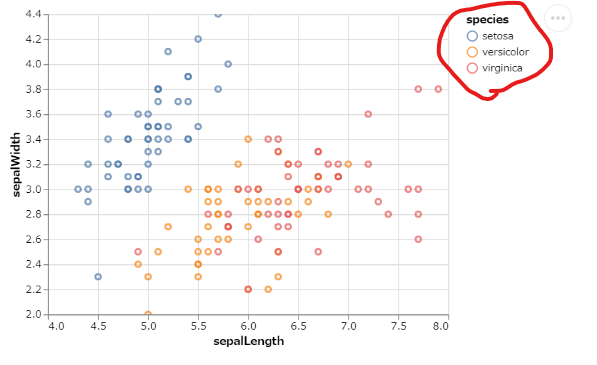
BEFORE デフォルトでは右側に出てしまいます
import altair as alt
from vega_datasets import data
iris = data.iris()

alt.Chart(iris).mark_point().encode(
    alt.X("sepalLength", scale=alt.Scale(zero=False)),
    alt.Y("sepalWidth", scale=alt.Scale(zero=False)),
    color="species"
).interactive()
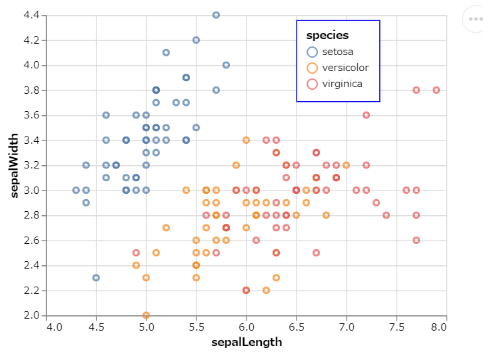
AFTER plot areaの任意の場所に移せます
import altair as alt
from vega_datasets import data
iris = data.iris()

alt.Chart(iris).mark_point().encode(
    alt.X("sepalLength", scale=alt.Scale(zero=False)),
    alt.Y("sepalWidth", scale=alt.Scale(zero=False)),
    color=alt.Color("species",
        legend=alt.Legend(orient='none', legendX=250, legendY=5,  ## orientをnoneに設定するとlegenX,legendYが指定できる
                strokeColor='blue', fillColor='white', padding=10)) ## legendの四角の設定
)
凡例設定のポイント
コードをみていただければ分かるかと思いますが、alt.Legendでいろいろと細かく調整できます。
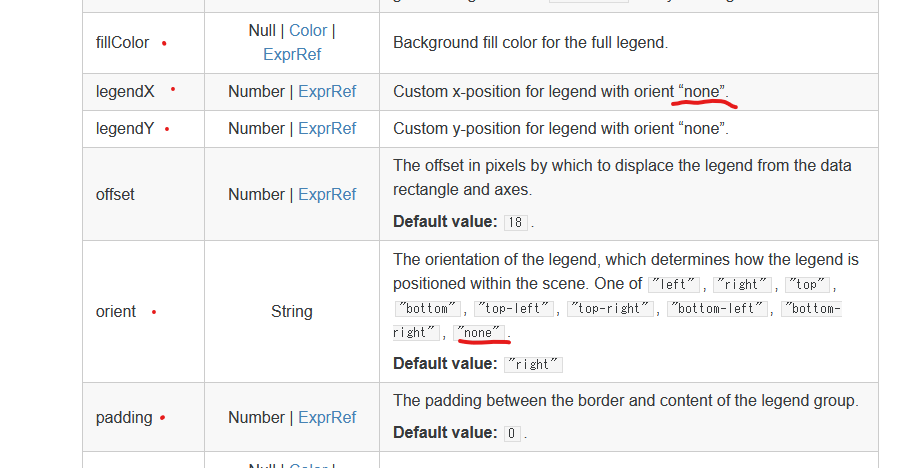
LegendXとLegendYで位置を調整できますが、その際にoriend='none'としておくのがポイントです。なお、このxとyの数値は何なのか、ちょっと分かりません・・なんとなくできてしまいますが、誰かご存知でしたら教えてください
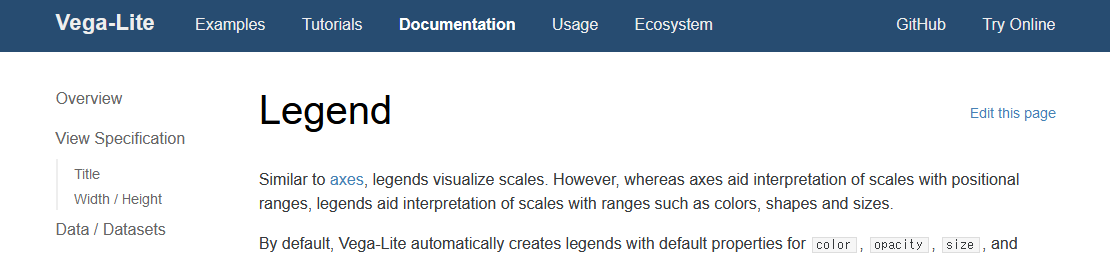
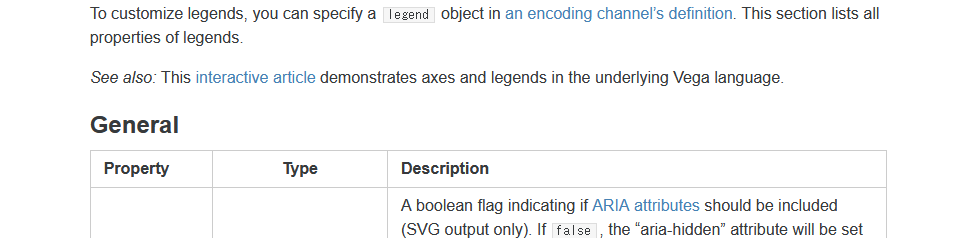
以下、参考にしたVeg-Liteのdocumentの大事なところをスクショして載せます。
Legend | Vega-Lite
https://vega.github.io/vega-lite/docs/legend.html
こちらの記事とは関係ありませんが、この中国の方のサイトの例は充実していました。
Python Altair COVID-19疫情数据可视化实践经验分享
https://www.cnblogs.com/dotlink/archive/2004/01/13/covid-19.html