Cloudflare の管理画面ではいい感じのトラフィック分析がいろいろ用意されています。
そのなかでも、ダッシュボードの Analytics 画面(Site Analytics)はそのサイト(ゾーン)で受信した HTTP リクエストの統計をいろんな側面から分析し、表示することで通信の傾向を把握するのに役立ちます。
https://support.cloudflare.com/hc/en-us/articles/360037684251-Understanding-Cloudflare-Site-Analytics
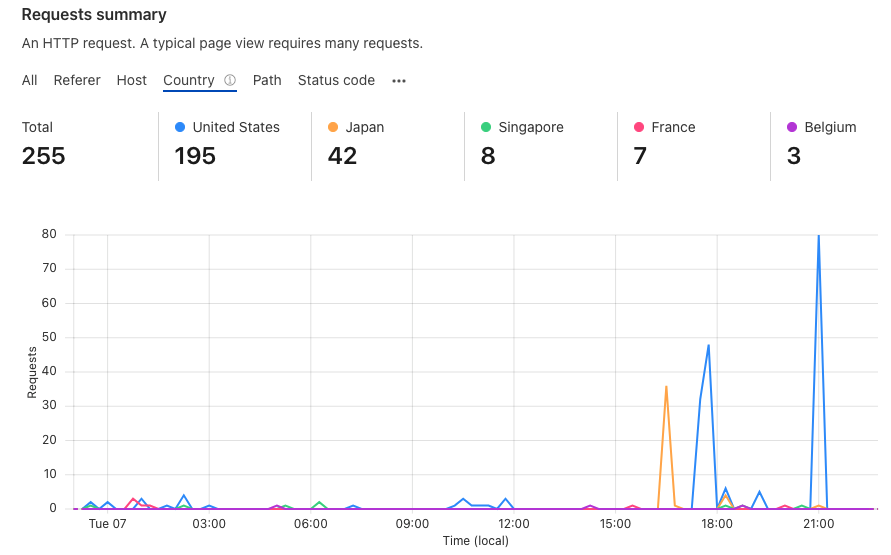
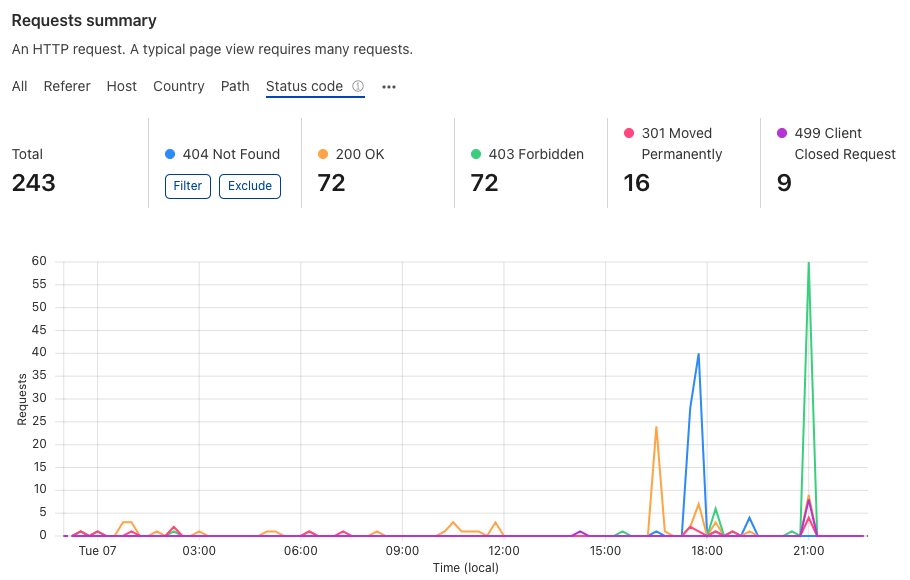
表示例
国別で見てみる
ステータスコード別で見てみる
Free プラン
ただ、Free プランでは下記のような簡素な表示になり、

Pro 以上にアップグレードしないと上記のような表示はされません。
GraphQL Analytics API
Free プランでも GraphQL Analytics API からであれば、同じような統計、分析情報を得ることができます。
https://developers.cloudflare.com/analytics/graphql-api
クエリ例
12月1日から7日までの受信トラフィックを国別で分析した結果を得てみます。
API TOKEN には Read Analytics and Logs を使用しています。
https://developers.cloudflare.com/api/tokens/create/template
curl -s -X POST -H "Authorization: Bearer $TOKEN_ANA" -H 'Content-Type: application/json' --data '{ "query": "query { viewer { zones(filter: {zoneTag: $ZONETAG}) { httpRequests1dGroups(limit: 7, orderBy: [date_ASC], filter: { date_gt: $DATEGT, date_lt: $DATELT }) { date: dimensions { date } sum { countryMap { requests, clientCountryName } } } } } }", "variables": { "ZONETAG":"<ゾーンタグ>", "DATEGT": "2021-12-01", "DATELT": "2021-12-07" } }' https://api.cloudflare.com/client/v4/graphql/
下記のような結果が得られました。
{
  "data": {
    "viewer": {
      "zones": [
        {
          "httpRequests1dGroups": [
            {
              "date": {
                "date": "2021-12-02"
              },
              "sum": {
                "countryMap": [
                  {
                    "clientCountryName": "FR",
                    "requests": 1
                  },
                  {
                    "clientCountryName": "GB",
                    "requests": 17
                  },
                  {
                    "clientCountryName": "US",
                    "requests": 1
                  }
                ]
              }
            },
            {
              "date": {
                "date": "2021-12-04"
              },
              "sum": {
                "countryMap": [
                  {
                    "clientCountryName": "FR",
                    "requests": 18
                  }
                ]
              }
            }
          ]
        }
      ]
    }
  },
  "errors": null
}
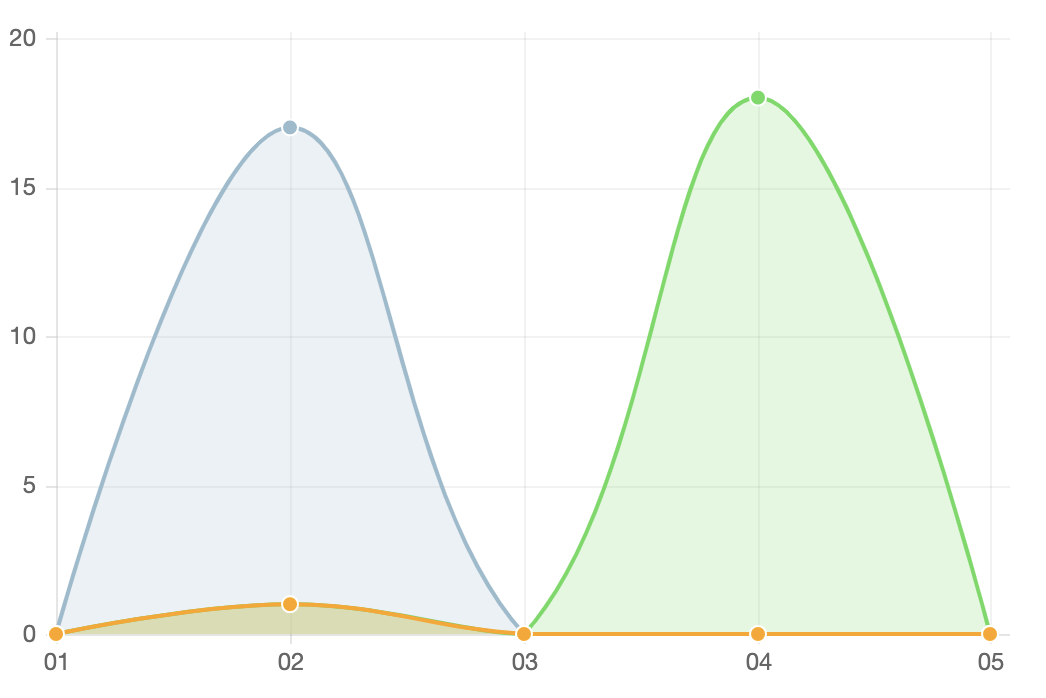
情報が得られたことで、手元でグラフ化することも可能になります。
その他の分析情報も得ることが可能です。
        {
          "httpRequests1dGroups": [
            {
              "dimensions": {
                "date": "2021-12-02"
              },
              "sum": {
                "bytes": 28952,
                "cachedBytes": 967,
                "cachedRequests": 1,
                "contentTypeMap": [
                  {
                    "bytes": 9846,
                    "edgeResponseContentTypeName": "html",
                    "requests": 1
                  },
                  {
                    "bytes": 19106,
                    "edgeResponseContentTypeName": "txt",
                    "requests": 18
                  }
                ],
                "countryMap": [
                  {
                    "bytes": 1067,
                    "clientCountryName": "FR"
                  },
                  {
                    "bytes": 18039,
                    "clientCountryName": "GB"
                  },
                  {
                    "bytes": 9846,
                    "clientCountryName": "US"
                  }
                ],
                "requests": 19,
                "responseStatusMap": [
                  {
                    "edgeResponseStatus": 403,
                    "requests": 18
                  },
                  {
                    "edgeResponseStatus": 503,
                    "requests": 1
                  }
                ]
              }
            },
まとめ
ひと手間必要にはなりますが、情報ソースは GraphQL Analytics API から得られますので、Free プランでもある程度情報の把握は可能となります。
また、GraphQL Analytics APIでは HTTP 以外の情報も得ることができます。
チュートリアルも用意されているので、参考になると思います。
https://developers.cloudflare.com/analytics/graphql-api/tutorials
また、今回紹介した Site Analytics 画面以外にも統計・分析機能は用意されており、下記に記載がありますのでご参照ください。
https://developers.cloudflare.com/analytics/