経路計画について解説しているものはいろいろあるが,それを行う場所(地図)の作り方があまり見つからなかったので,まとめる.
迷路探索用迷路
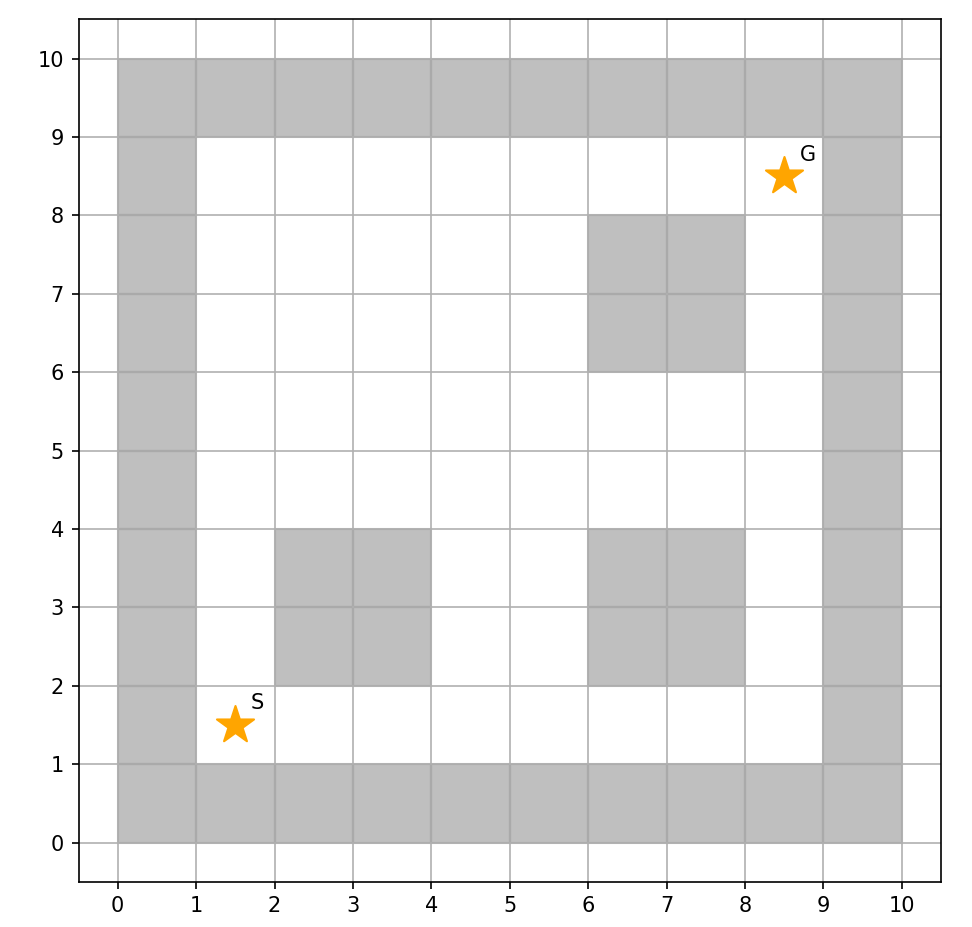
まず,二次元の経路計画のため,迷路内部の障害物とスタート&ゴールからなる迷路を生成した.
迷路周囲の壁と迷路内部の障害物は通行不可であり,グレーで表示される.一方で,通行可能なマスは白色で表示されるようになっている.
手動設定用マップ
障害物の位置やスタート&ゴール位置を手動で決め,迷路を生成する.
コード全容
import numpy

import matplotlib.pyplot as plt
from matplotlib import patches
from matplotlib.animation import FuncAnimation

class Maze:
    ###########
    # class to create&show maze map
    # * input:
    #     * grid size of map: map_size=(10,10)
    #     * number of objects: object_num=25
    #     * cost for objects: object_cost=9

    # * output:
    #     * middle points of each side: mid_list
    ###########
    def __init__(self, map_size=(10,10), object_num=25, object_cost=9):
        self.map_size = map_size
        self.object_num = object_num
        self.maze = [[0] * self.map_size[0] for i in range(self.map_size[1])]
        self.object_cost = object_cost
        pass

    def generation_map(self, object_list, start, goal):
        ###########
        # function to create maze map
        # * input:
        #     * list of objects positions: object_list
        #     * start position: start
        #     * goal position: goal

        # * output:
        #     * list describing as a maze map: self.maze
        #     * start position : self.start
        #     * goal position:  self.goal
        ###########

        # set cost of maze outline
        ## 外壁を迷路の外周に設置.コストは障害物と同じ
        for i in range(self.map_size[1]):
            self.maze[0][i] = self.object_cost
            self.maze[self.map_size[0] - 1][i] = self.object_cost

        for j in range(self.map_size[0]):
            self.maze[j][0] = self.object_cost
            self.maze[j][self.map_size[1] - 1] = self.object_cost

        # set cost of objects (like wall...). Number of object is set at first
        ## 障害物を特定の位置に配置.コストは引数にて設定済みのを使う
        if object_list:
            self.object_num = len(object_list)
            ### 障害物のコストを設定
            for object in object_list:
                self.maze[object[0]][object[1]] = self.object_cost

        # set start&goal position with position class
        ## positionクラスを利用して,スタート&ゴール位置を設定
        ### 場合によってはここで追加情報を設定する(planning手法による)
        self.goal = goal
        self.start = start
        # set cost
        ## スタート&ゴール位置のコストを設定(ゴールのコストは,ゴール位置の判別に使う)
        self.maze[start.x][start.y] = -1
        self.maze[goal.x][goal.y] = 1

        return self.maze, self.start, self.goal

    def set_maze_graph(self):
    ###########
    # function to show maze map
    # * input:
    #     * size of maze map: self.map_size
    #     * list describing as a maze map: self.maze
    #     * start position : self.start
    #     * goal position:  self.goal

    # * output:
    #     * graph information:  fig, ax
    ###########
        fig, ax = plt.subplots(figsize=self.map_size)

        ax.set_xticks(list(range(self.map_size[0]+1)))
        ax.set_yticks(list(range(self.map_size[1]+1)))
        ax.grid()
        ax.set_aspect('equal')

        # set maze
        ## 障害物部分(コストが設定したobject_costと一致するグリッド)をグレーに塗りつぶす
        for x in range(self.map_size[0]):
                for y in range(self.map_size[1]):
                    if self.maze[x][y] == self.object_cost:
                        r = patches.Rectangle( xy=(x,y), width=1, height=1, color="grey", alpha=0.5) # 四角形のオブジェクト
                        # 4. Axesに図形オブジェクト追加・表示
                        ax.add_patch(r)

        # set star&goal position
        ## スタート&ゴール位置に分かりやすいよう☆マークを表示する
        ## ただし,グリッドの中央に☆が表示されるよう,座標を変換する
        s2g = [[self.start.convert_coordinate().x, self.goal.convert_coordinate().x],
                 [self.start.convert_coordinate().y, self.goal.convert_coordinate().y]]

        ax.scatter(s2g[0], s2g[1], c="orange", marker="*", s=350)
        plt.text(self.start.x + 0.7, self.start.y + 0.7, "S")
        plt.text(self.goal.x + 0.7, self.goal.y + 0.7, "G")
        return fig, ax


class Position:
    ###########
    # class to describe position
    # * input:
    #     * x & y position of current position: x, y
    #     * distance from start position: depth
    #     * x & y position of parent grid: parent_x & parent_y
    ###########
    def __init__(self, x, y, depth=0, parent_x=-1, parent_y=-1):
        self.x = x                  # x座標
        self.y = y                  # y座標
        self.depth = depth          # 移動回数
        self.parent_x = parent_x    # 一つ前に通ったマスのx座標
        self.parent_y = parent_y    # 一つ前に通ったマスのy座標


    def convert_coordinate(self):
        ###########
        # function to convert coordinate to show marker at the center of grid
        # * input:
        #     * x & y position of current position: self.x, self.y

        # * output:
        #     * converted x & y position: graph_coordinate
        ###########

        graph_coordinate = Position(self.x+0.5, self.y+0.5)
        return graph_coordinate


if __name__ == '__main__':

    object_list = [(2,2), (2,3), (3,2), (3,3), (6,2), (6,3), (7,2), (7,3), (6,6), (6,7), (7,6), (7,7)]
    start = Position(1, 1, 0)
    goal = Position(8, 8, 0)

    create_maze = Maze(object_cost=100)
    # generate map
    maze, start, goal = create_maze.generation_map(object_list, start, goal)
    fig, ax = create_maze.set_maze_graph()
    plt.show()
コード概説
コードは主に,迷路を生成するMazeクラスと位置情報を格納するPositionクラスの2つからなる.
Positionクラス
このクラスは位置情報を格納する.Mazeの作成段階ではx,y座標しか格納しないが,経路生成のときには,一つ前のマスやそのマスまでにかかった合計コストを記録したりもする.
迷路生成だけのときは,Positionクラスは1つの関数のみを持つ
convert_coordinate() 関数
これは,単にグラフを書く際にグリッドの中心にマーカーが表示された方がきれいなので,そのための座標変換関数.
class Position:
    ###########
    # class to describe position
    # * input:
    #     * x & y position of current position: x, y
    #     * distance from start position: depth
    #     * x & y position of parent grid: parent_x & parent_y
    ###########
    def __init__(self, x, y, depth=0, parent_x=-1, parent_y=-1):
        self.x = x                  # x座標
        self.y = y                  # y座標
        self.depth = depth          # 移動回数
        self.parent_x = parent_x    # 一つ前に通ったマスのx座標
        self.parent_y = parent_y    # 一つ前に通ったマスのy座標


    def convert_coordinate(self):
        ###########
        # function to convert coordinate to show marker at the center of grid
        # * input:
        #     * x & y position of current position: self.x, self.y

        # * output:
        #     * converted x & y position: graph_coordinate
        ###########

        graph_coordinate = Position(self.x+0.5, self.y+0.5)
        return graph_coordinate
Mazeクラス
迷路を生成するクラス.
マップの大きさや障害物の数,障害物を表すコストを設定できる.ただし,マニュアル設定の場合は,障害物の数は後で入力する障害物のリストに応じて上書きされる.
以下の2つの関数からなる
class Maze:
    ###########
    # class to create&show maze map
    # * input:
    #     * grid size of map: map_size=(10,10)
    #     * number of objects: object_num=25
    #     * cost for objects: object_cost=9

    # * output:
    #     * middle points of each side: mid_list
    ###########

    def __init__(self, map_size=(10,10), object_num=25, object_cost=9):
        self.map_size = map_size
        self.object_num = object_num
        self.maze = [[0] * self.map_size[0] for i in range(self.map_size[1])]
        self.object_cost = object_cost
        pass
generation_map() 関数
Maze関数の屋台骨であるマップ生成関数.
障害物の位置を記載したobject_listとスタート&ゴール位置を引数として,マップを生成する.
障害物やスタート&ゴール位置のコストを設定するのもここ.
    def generation_map(self, object_list, start, goal):
        ###########
        # function to create maze map
        # * input:
        #     * list of objects positions: object_list
        #     * start position: start
        #     * goal position: goal

        # * output:
        #     * list describing as a maze map: self.maze
        #     * start position : self.start
        #     * goal position:  self.goal
        ###########

        # set cost of maze outline
        ## 外壁を迷路の外周に設置.コストは障害物と同じ
        for i in range(self.map_size[1]):
            self.maze[0][i] = self.object_cost
            self.maze[self.map_size[0] - 1][i] = self.object_cost

        for j in range(self.map_size[0]):
            self.maze[j][0] = self.object_cost
            self.maze[j][self.map_size[1] - 1] = self.object_cost

        # set cost of objects (like wall...). Number of object is set at first
        ## 障害物を特定の位置に配置.コストは引数にて設定済みのを使う
        if object_list:
            self.object_num = len(object_list)
            ### 障害物のコストを設定
            for object in object_list:
                self.maze[object[0]][object[1]] = self.object_cost

        # set start&goal position with position class
        ## positionクラスを利用して,スタート&ゴール位置を設定
        ### 場合によってはここで追加情報を設定する(planning手法による)
        self.goal = goal
        self.start = start
        # set cost
        ## スタート&ゴール位置のコストを設定(ゴールのコストは,ゴール位置の判別に使う)
        self.maze[start.x][start.y] = -1
        self.maze[goal.x][goal.y] = 1

        return self.maze, self.start, self.goal
set_maze_graph() 関数
作成したマップをグラフとして表示するのがこのset_maze_graph() 関数.
スタート&ゴール位置を☆マークで表示しているのがこだわり(笑)
    def set_maze_graph(self):
    ###########
    # function to show maze map
    # * input:
    #     * size of maze map: self.map_size
    #     * list describing as a maze map: self.maze
    #     * start position : self.start
    #     * goal position:  self.goal

    # * output:
    #     * graph information:  fig, ax
    ###########
        fig, ax = plt.subplots(figsize=self.map_size)

        ax.set_xticks(list(range(self.map_size[0]+1)))
        ax.set_yticks(list(range(self.map_size[1]+1)))
        ax.grid()
        ax.set_aspect('equal')

        # set maze
        ## 障害物部分(コストが設定したobject_costと一致するグリッド)をグレーに塗りつぶす
        for x in range(self.map_size[0]):
                for y in range(self.map_size[1]):
                    if self.maze[x][y] == self.object_cost:
                        r = patches.Rectangle( xy=(x,y), width=1, height=1, color="grey", alpha=0.5) # 四角形のオブジェクト
                        # 4. Axesに図形オブジェクト追加・表示
                        ax.add_patch(r)

        # set star&goal position
        ## スタート&ゴール位置に分かりやすいよう☆マークを表示する
        ## ただし,グリッドの中央に☆が表示されるよう,座標を変換する
        s2g = [[self.start.convert_coordinate().x, self.goal.convert_coordinate().x],
                 [self.start.convert_coordinate().y, self.goal.convert_coordinate().y]]

        ax.scatter(s2g[0], s2g[1], c="orange", marker="*", s=350)
        plt.text(self.start.x + 0.7, self.start.y + 0.7, "S")
        plt.text(self.goal.x + 0.7, self.goal.y + 0.7, "G")
        return fig, ax
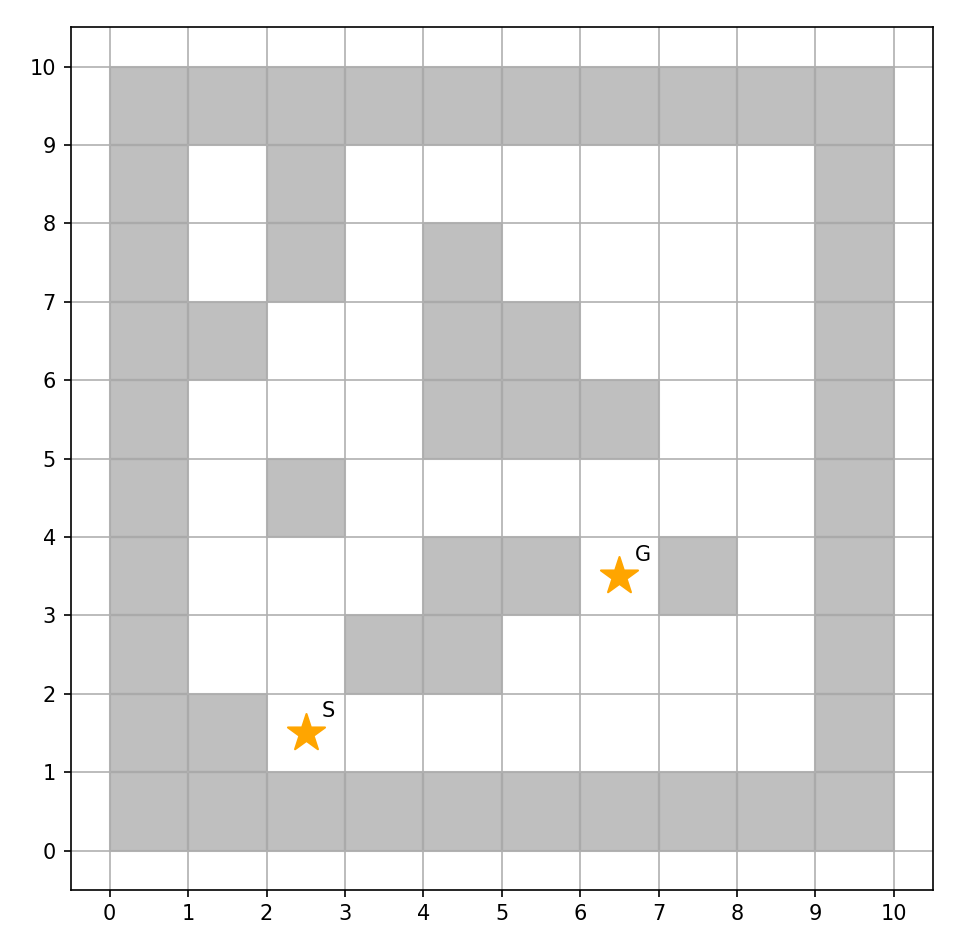
ランダム設定マップ
障害物の位置やスタート&ゴール位置をランダムに決まるよう設定し,迷路を生成する.
コード全容
import itertools
import random
import matplotlib.pyplot as plt
from matplotlib import patches

class Maze:
    ###########
    # class to create&show maze map
    # * input:
    #     * grid size of map: map_size=(10,10)
    #     * number of objects: object_num=25
    #     * cost for objects: object_cost=9

    # * output:
    #     * middle points of each side: mid_list
    ###########

    def __init__(self, map_size=(10,10), object_num=25, object_cost=9):
        self.map_size = map_size
        self.object_num = object_num
        self.maze = [[0] * self.map_size[0] for i in range(self.map_size[1])]
        self.object_cost = object_cost
        pass

    def choice_and_del(self, choice_list, choice_num):
        ###########
        # function to pick up some values from list ramdomly
        # 指定された個数(choice_num)だけ,任意のxy座標を返す関数
        # * input:
        #     * list to be picked up values: choice_list
        #     * the number of values to be choosed: choice_num

        # * output:
        #     * list picked up: ret_list
        ###########

        ret_list = []
        for _ in range(choice_num):
            # set index number
            index = random.choice(range(len(choice_list)))
            # get the value of identified index and delete it from the choice_list
            # add the value to ret_list
            ret_list.append(choice_list.pop(index))
        return ret_list

    def generation_map(self):
        ###########
        # function to create maze map
        # 迷路の生成
        # * input:
        #     * start position: start
        #     * goal position: goal

        # * output:
        #     * list describing as a maze map: self.maze
        #     * start position : self.start
        #     * goal position:  self.goal
        ###########

        # return coordinate list ([0,0], [0,1], [0,2] .... [5,3],[5,4],[5,5])
        ## itertools.puroduct returns puroduct(積) of 0~5 x 0~5
        map_list = list(itertools.product(range(self.map_size[0]), range(self.map_size[1])))

        # set cost of maze outline
        ## 外壁を迷路の外周に設置.コストは障害物と同じ
        for i in range(self.map_size[1]):
            self.maze[0][i] = self.object_cost
            self.maze[self.map_size[0] - 1][i] = self.object_cost

        for j in range(self.map_size[0]):
            self.maze[j][0] = self.object_cost
            self.maze[j][self.map_size[1] - 1] = self.object_cost

        # set cost of objects (like wall...). Number of object is set at first
        ## 障害物の位置をランダムに配置.コストは引数にて設定済みのを使う
        if self.object_num > 0:
            ### 障害物の位置を決める
            object_coords = self.choice_and_del(map_list, self.object_num)
            ### 障害物のコストを設定
            for object_coord in object_coords:
                self.maze[object_coord[0]][object_coord[1]] = self.object_cost

        # スタートとゴール地点を設定.
        # set start&goal position with position class
        # ただし,障害物上に設定されそうなときは,選び直す
        # choice one coordinate as a start, which doesn't on object(cost 9)
        # and convert it to the list style
        ## スタート位置
        start = self.choice_and_del(map_list, 1)
        while self.maze[start[0][0]][start[0][1]] == self.object_cost:
            start = self.choice_and_del(map_list, 1)

        self.start = Position(start[0][0], start[0][1], 0)
        ## ゴール位置
        ## ただし,ゴール位置は障害物だけでなく,スタート位置とも被らない用に設定する
        goal = self.choice_and_del(map_list, 1)
        while self.maze[goal[0][0]][goal[0][1]] == self.object_cost or\
              (goal[0][0] == start[0][0] and goal[0][1] == start[0][1]):
            goal = self.choice_and_del(map_list, 1)

        # set cost of goal
        ## 場合によってはここで追加情報を設定する(planning手法による)
        self.maze[goal[0][0]][goal[0][1]] = 1
        self.goal = Position(goal[0][0], goal[0][1], 0)

        return self.maze, self.start, self.goal

    def set_maze_graph(self):
    ###########
    # function to show maze map
    # * input:
    #     * size of maze map: self.map_size
    #     * list describing as a maze map: self.maze
    #     * start position : self.start
    #     * goal position:  self.goal

    # * output:
    #     * graph information:  fig, ax
    ###########
        fig, ax = plt.subplots(figsize=self.map_size)

        ax.set_xticks(list(range(self.map_size[0]+1)))
        ax.set_yticks(list(range(self.map_size[1]+1)))
        ax.grid()
        ax.set_aspect('equal')

        # set maze
        ## 障害物部分(コストが設定したobject_costと一致するグリッド)をグレーに塗りつぶす
        for x in range(self.map_size[0]):
                for y in range(self.map_size[1]):
                    if self.maze[x][y] == self.object_cost:
                        r = patches.Rectangle( xy=(x,y), width=1, height=1, color="grey", alpha=0.5) # 四角形のオブジェクト
                        # 4. Axesに図形オブジェクト追加・表示
                        ax.add_patch(r)

        # set star&goal position
        ## スタート&ゴール位置に分かりやすいよう☆マークを表示する
        ## ただし,グリッドの中央に☆が表示されるよう,座標を変換する
        s2g = [[self.start.convert_coordinate().x, self.goal.convert_coordinate().x],
                 [self.start.convert_coordinate().y, self.goal.convert_coordinate().y]]

        ax.scatter(s2g[0], s2g[1], c="orange", marker="*", s=350)
        plt.text(self.start.x + 0.7, self.start.y + 0.7, "S")
        plt.text(self.goal.x + 0.7, self.goal.y + 0.7, "G")
        return fig, ax


class Position:
    ###########
    # class to describe position
    # * input:
    #     * x & y position of current position: x, y
    #     * distance from start position: depth
    #     * x & y position of parent grid: parent_x & parent_y
    ###########

    def __init__(self, x, y, depth=0, parent_x=-1, parent_y=-1):
        self.x = x                  # x座標
        self.y = y                  # y座標
        self.depth = depth          # 移動回数
        self.parent_x = parent_x    # 一つ前に通ったマスのx座標
        self.parent_y = parent_y    # 一つ前に通ったマスのy座標

    def convert_coordinate(self):
        ###########
        # function to convert coordinate to show marker at the center of grid
        # * input:
        #     * x & y position of current position: self.x, self.y

        # * output:
        #     * converted x & y position: graph_coordinate
        ###########

        graph_coordinate = Position(self.x+0.5, self.y+0.5)
        return graph_coordinate

if __name__ == '__main__':

    create_maze = Maze()
    # generate map
    maze, start, goal = create_maze.generation_map() # generate map
    fig, ax = create_maze.set_maze_graph()
    plt.show()```
## コード概説
### Positionクラス
スタートとゴール(経路計画の際には探索したマス)の位置関連情報を格納するためのクラス.
迷路生成では,スタートとゴール位置を格納しているだけ.
```python:Poision class
class Position:
    def __init__(self, x, y, depth=0, parent_x=-1, parent_y=-1):
        self.x = x                  # x座標
        self.y = y                  # y座標
        self.depth = depth          # 移動回数
        self.parent_x = parent_x    # 一つ前に通ったマスのx座標
        self.parent_y = parent_y    # 一つ前に通ったマスのy座標

    def convert_coordinate(self):
        graph_coordinate = Position(self.x+0.5, self.y+0.5)
        return graph_coordinate
コード概説
ここでは,先に説明した手動で設定する迷路に追記した部分を説明する.
ただし,Positionクラスは変更点がないので,Mazeクラスのみについて考える.
Mazeクラス
設定した大きさのハコに,設定した数の障害物とスタート&ゴール地点をランダムに配置し,迷路を生成するクラス
追記&変更したのは以下の2つ
choice_and_del() 関数
与えられたリストの中から,指定された個数だけ[x,y]座標をランダムに選んで返す関数.
ただし,[x,y]座標は2つで1つ(1ペア)とみなされる必要があるので,入力するリストは二次元配列とする.(ex. [[0,0],[0,1],[0,2] .... [5,3],[5,4],[5,5]])
def choice_and_del(self, choice_list, choice_num):
        ###########
        # function to pick up some values from list ramdomly
        # 指定された個数(choice_num)だけ,任意のxy座標を返す関数
        # * input:
        #     * list to be picked up values: choice_list
        #     * the number of values to be choosed: choice_num

        # * output:
        #     * list picked up: ret_list
        ###########

        ret_list = []
        for _ in range(choice_num):
            # set index number
            index = random.choice(range(len(choice_list)))
            # get the value of identified index and delete it from the choice_list
            # add the value to ret_list
            ret_list.append(choice_list.pop(index))
        return ret_list
generation_map() 関数
先ほどのchoice_and_del() 関数を利用して,障害物の位置やスタート&ゴール位置をランダムに選ぶ.
選んだ後は,手動設定と同様にコストを設定したりする.
ただし,スタート位置は障害物と,ゴール位置は障害物やスタート位置と重ならないようにする必要がある.そのため,ここでは,重なった場合は選び直すようにしてある.
def generation_map(self):
        ###########
        # function to create maze map
        # 迷路の生成
        # * input:
        #     * start position: start
        #     * goal position: goal

        # * output:
        #     * list describing as a maze map: self.maze
        #     * start position : self.start
        #     * goal position:  self.goal
        ###########

        # return coordinate list ([0,0], [0,1], [0,2] .... [5,3],[5,4],[5,5])
        ## itertools.puroduct returns puroduct(積) of 0~5 x 0~5
        map_list = list(itertools.product(range(self.map_size[0]), range(self.map_size[1])))

        # set cost of maze outline
        ## 外壁を迷路の外周に設置.コストは障害物と同じ
        for i in range(self.map_size[1]):
            self.maze[0][i] = self.object_cost
            self.maze[self.map_size[0] - 1][i] = self.object_cost

        for j in range(self.map_size[0]):
            self.maze[j][0] = self.object_cost
            self.maze[j][self.map_size[1] - 1] = self.object_cost

        # set cost of objects (like wall...). Number of object is set at first
        ## 障害物の位置をランダムに配置.コストは引数にて設定済みのを使う
        if self.object_num > 0:
            ### 障害物の位置を決める
            object_coords = self.choice_and_del(map_list, self.object_num)
            ### 障害物のコストを設定
            for object_coord in object_coords:
                self.maze[object_coord[0]][object_coord[1]] = self.object_cost

        # スタートとゴール地点を設定.
        # set start&goal position with position class
        # ただし,障害物上に設定されそうなときは,選び直す
        # choice one coordinate as a start, which doesn't on object(cost 9)
        # and convert it to the list style
        ## スタート位置
        start = self.choice_and_del(map_list, 1)
        while self.maze[start[0][0]][start[0][1]] == self.object_cost:
            start = self.choice_and_del(map_list, 1)

        self.start = Position(start[0][0], start[0][1], 0)
        ## ゴール位置
        ## ただし,ゴール位置は障害物だけでなく,スタート位置とも被らない用に設定する
        goal = self.choice_and_del(map_list, 1)
        while self.maze[goal[0][0]][goal[0][1]] == self.object_cost or\
              (goal[0][0] == start[0][0] and goal[0][1] == start[0][1]):
            goal = self.choice_and_del(map_list, 1)

        # set cost of goal
        ## 場合によってはここで追加情報を設定する(planning手法による)
        self.maze[goal[0][0]][goal[0][1]] = 1
        self.goal = Position(goal[0][0], goal[0][1], 0)

        return self.maze, self.start, self.goal
以上,毎回異なる形の迷路が生成されるようになった.
経路計画用不整地
迷路探索では,通行可能なマス・通行不可なマス(障害物)の2種類のマスしか存在しなかった.
一方で,実際のロボットは通行可能であっても凹凸があったり,障害物はないけれど傾斜が急すぎて走行できない...ということがある.
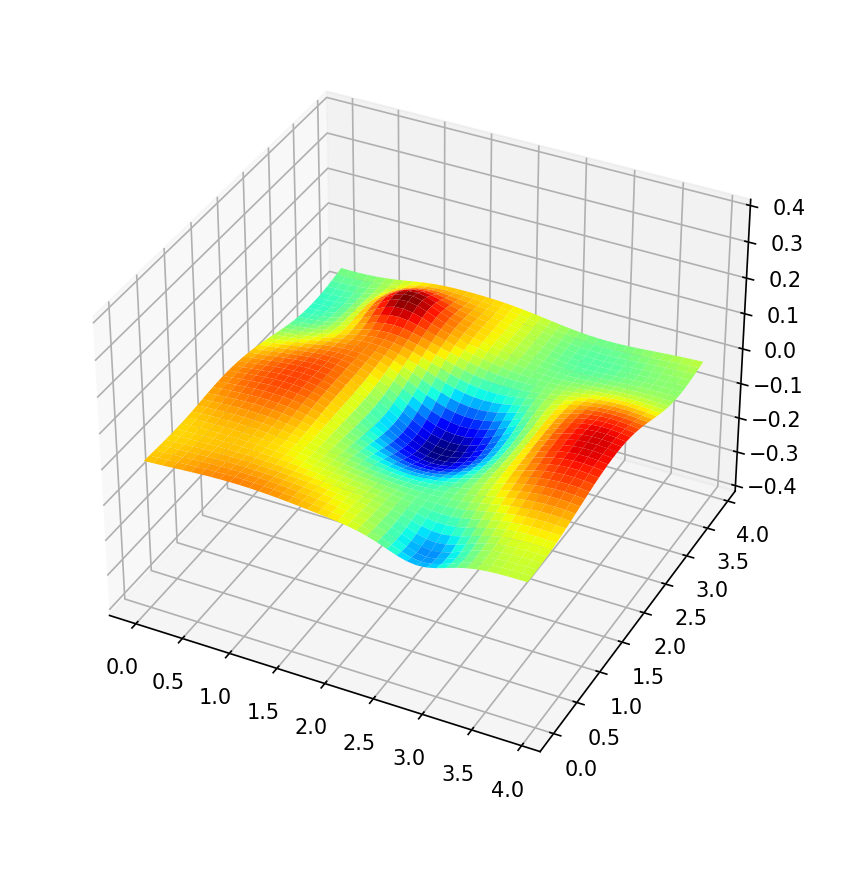
そんな環境における経路計画(2.5次元)を考えるため,凹凸のある環境地図を作成した.
凹凸位置を手動設定する場合
コード全容
import numpy as np
import matplotlib.pyplot as plt
from mpl_toolkits.mplot3d import axes3d
from matplotlib import cm
#二次元正規分布の確率密度を返す関数
class Gaussian:
##########
# * input with set_mount():
# * position of hill/hole: pos
# * diameter of hill/hole: dia
# * height/depth of hill/hole: height
# * output with gaussian():
# * gaussian destribution: gauss
##########
# 初期設定する関数
def __init__(self):
# 2変数の平均値(peakのXY位置)を指定
self.MU_X = 0
self.MU_Y = 0
# 2変数の分散共分散行列を指定(すそ野の広がりの大きさ)
self.SIGMA_X = 40
self.SIGMA_Y = 40
# 最大値を指定
self.peak = 0.1
pass
# 凹凸の位置・直径・高さ設定する関数
def set_mount(self, pos, dia, height):
# 2変数の平均値(peakのXY位置)を指定
self.MU_X, self.MU_Y = pos
# 2変数の分散共分散行列を指定(すそ野の広がりの大きさ)
self.SIGMA_X, self.SIGMA_Y = [d/6 for d in dia]
# 最大値を指定
self.peak = height
# 凹凸の設定を平均値と標準偏差に変換する関数
def set_const(self):
#2変数の平均値を指定
self.MU = np.array([self.MU_X, self.MU_Y])
#2変数の分散共分散行列を指定
self.SIGMA = np.array([[self.SIGMA_X, 0],
[0, self.SIGMA_Y]])
# 最大値を設定した高さと一致するよう修正する関数
def modify_peak(self, gauss):
peak0 = np.amax(gauss)
gauss = gauss * (self.peak/peak0)
return gauss
# 平均値と標準偏差を満たす正規分布図を作成する関数
def gaussian(self, x):
# 定数(平均値と共分散行列)を定義
self.set_const()
# 分散共分散行列の行列式
det = np.linalg.det(self.SIGMA)
# print(det)
# 分散共分散行列の逆行列
inv = np.linalg.inv(self.SIGMA)
n = x.ndim # 行列の次元数を取得
# print(inv)
gauss = np.exp(-np.diag((x - self.MU)@inv@(x - self.MU).T)/2.0) / (np.sqrt((2 * np.pi) ** n * det))
# 頂点高さを補正
gauss = self.modify_peak(gauss)
return gauss
if __name__ == '__main__':
#関数に投入するデータを作成
x = y = np.arange(0, 4, 0.1)
X, Y = np.meshgrid(x, y)
z = np.c_[X.ravel(),Y.ravel()]
# 凹凸の位置・直径・高さを設定
Zs = np.zeros((13, 1600))
pos = np.array([[2, 2],
[1, 0.5],
[0.8, 0.8],
[0.5, 1],
[3.5, 0.8],
[3.6, 1.5],
[2.8, 0.2],
[1.3, 2.5],
[0.4, 3.2],
[1.0, 3.3],
[2.8, 3.6],
[3.6, 2.8],
[3.8, 3]])
dia = np.array([[2, 2],
[2.5, 3],
[3, 2],
[2, 2.3],
[5, 5],
[2, 5],
[0.5, 0.7],
[3, 5],
[5, 3],
[0.5, 0.5],
[2, 2],
[3, 2],
[4, 2]])
height = np.array([0.14, 0.05, 0.09, 0.05, 0.05, 0.07, 0.05, 0.07, 0.06, 0.06, 0.03, 0.05, 0.07])
# 凹凸の生成
G = Gaussian()
if len(pos) == len(dia) and len(pos) == len(height):
mount_num = len(height)
for i in range(mount_num):
G.set_mount(pos[i,:], dia[i, :], height[i])
Zs[i,:] = G.gaussian(z)
sum = np.zeros(1600)
for i in range(mount_num):
sum = sum + (-1)**(i+1) * Zs[i,:]
Z = sum
shape = X.shape
Z = Z.reshape(shape)
#二次元正規分布をplot
fig = plt.figure(figsize = (15, 15))
ax = fig.add_subplot(111, projection='3d')
ax.set_xlabel('X Label')
ax.set_ylabel('Y Label')
ax.set_zlabel('Z Label')
ax.set_zlim(-0.4,0.4)
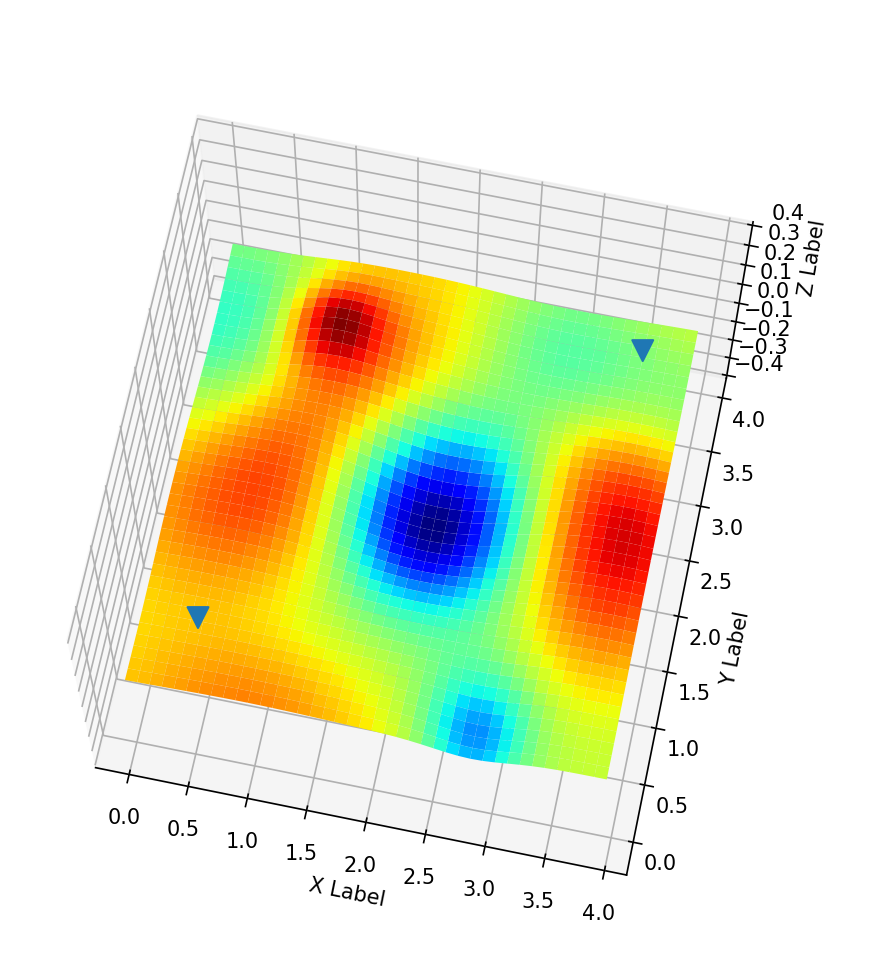
point_x = np.array([X[5,5], X[35,35]])
point_y = np.array([Y[5,5], Y[35,35]])
point_z = np.array([Z[5,5]+0.1, Z[35,35]+0.1])
ax.plot_surface(X, Y, Z, rstride=1, cstride=1, cmap=cm.jet)
ax.scatter(point_x, point_y, point_z, s=100, marker="v", alpha=1)
plt.show()
else:
print("\033[31m" + "Error!!: the size of three arrays are not the same.\n Check & modify it." + "\033[0m")
下図のような3次元マップが表示される.
コード概説
このコードでは,Gaussianクラスを用いて凹凸を表す行列を作成し,それらを重ね合わせてグラフに表示している.
Gaussianクラス
このクラスでは,二次元正規分布の確率密度を表すガウス関数を用いて,凹凸を表現している.
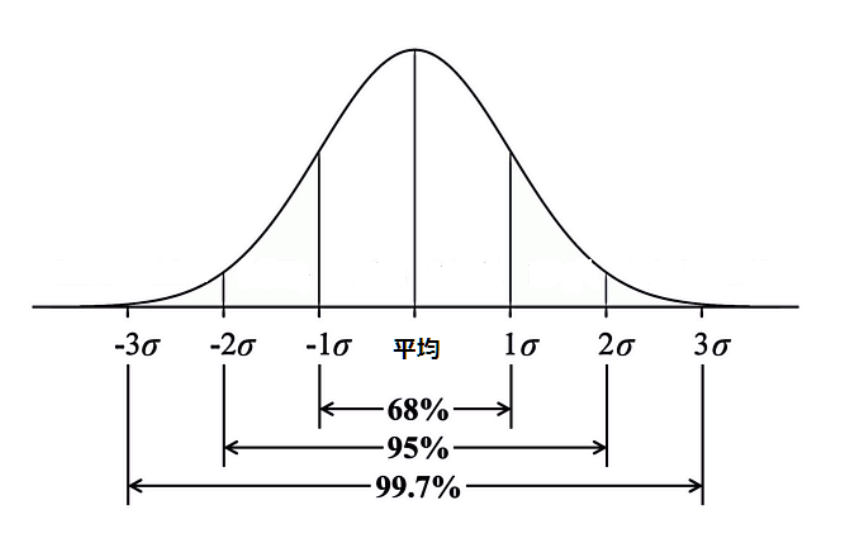
正規分布は上に凸の形をとり,頂点位置は平均値 µ ,すそ野の広さ(なだらかさ)は標準偏差 σによって下図のように決められる.
最小構成
下記のコードがこのクラスの最小構成である.平均値µと標準偏差σの値を設定することで,凹凸を生成できる.- 平均値µ:凹凸の中心位置(頂点位置)のXY座標
- 標準偏差σ:凹凸のすそ野の広さ(なだらかさ)を表し,X=YならX方向とY方向に対称な形となり,X≠Yなら非対称な形の凹凸になる.
#二次元正規分布の確率密度を返す関数
class Gaussian:
    ##########
    # * output with gaussian():
    #     * gaussian destribution: gauss
    ##########

    # 初期設定する関数
    def __init__(self):
        # 2変数の平均値(peakのXY位置)を指定
        self.MU_X = 0
        self.MU_Y = 0
        # 2変数の分散共分散行列を指定(すそ野の広がりの大きさ)
        self.SIGMA_X = 40
        self.SIGMA_Y = 40

        # 最大値を指定
        self.peak = 0.1
        pass


    # 凹凸の設定を平均値と標準偏差に変換する関数
    def set_const(self):
        #2変数の平均値を指定
        self.MU = np.array([self.MU_X, self.MU_Y])
        #2変数の分散共分散行列を指定
        self.SIGMA = np.array([[self.SIGMA_X, 0],
                               [0, self.SIGMA_Y]])

    # 平均値と標準偏差を満たす正規分布図を作成する関数
    def gaussian(self, x):
        ## 定数(平均値と共分散行列)を定義
        # self.set_const()
        # 分散共分散行列の行列式
        det = np.linalg.det(self.SIGMA)
        # print(det)
        # 分散共分散行列の逆行列
        inv = np.linalg.inv(self.SIGMA)
        n = x.ndim # 行列の次元数を取得
        # print(inv)
        gauss = np.exp(-np.diag((x - self.MU)@inv@(x - self.MU).T)/2.0) / (np.sqrt((2 * np.pi) ** n * det))
        ## 頂点高さを補正
        # gauss = self.modify_peak(gauss)
        return gauss
その他の関数
最小構成では,頂点位置は分かってもどのくらいのなだらかさで,どのくらいの高さの凹凸が出来上がるか直感的に分からない.
そこで残りの3つの関数では,凹凸の直感的な形状(位置・直径・高さ)を正規分布の定義に必要な平均値µや標準偏差σに変換したり,出来上がった正規分布の最大値を設定された高さと一致するよう補正をかけたりしている.
    # 凹凸の位置・直径・高さ設定する関数
    def set_mount(self, pos, dia, height):
        # 2変数の平均値(peakのXY位置)を指定
        self.MU_X, self.MU_Y = pos
        # 2変数の分散共分散行列を指定(すそ野の広がりの大きさ)
        self.SIGMA_X, self.SIGMA_Y = [d/6 for d in dia]
        # 最大値を指定
        self.peak = height

    # 凹凸の設定を平均値と標準偏差に変換する関数
    def set_const(self):
        #2変数の平均値を指定
        self.MU = np.array([self.MU_X, self.MU_Y])
        #2変数の分散共分散行列を指定
        self.SIGMA = np.array([[self.SIGMA_X, 0],
                               [0, self.SIGMA_Y]])

    # 最大値を設定した高さと一致するよう修正する関数
    def modify_peak(self, gauss):
        peak0 = np.amax(gauss)
        gauss = gauss * (self.peak/peak0)
        return gauss
main関数
main関数は,以下の流れからなる.
- 凹凸の位置・直径・高さを設定し,
- 設定に基づき凹凸の生成を行う.
- ただし,位置・直径・高さの各行列について,要素数がすべて同じでない場合はエラーメッセージを表示する.
if __name__ == '__main__':
    #関数に投入するデータを作成
    x = y = np.arange(0, 4, 0.1)
    X, Y = np.meshgrid(x, y)

    z = np.c_[X.ravel(),Y.ravel()]
    # 凹凸の位置・直径・高さを設定
    Zs = np.zeros((13, 1600))
    pos = np.array([[2, 2],
                    [1, 0.5],
                    [0.8, 0.8],
                    [0.5, 1],
                    [3.5, 0.8],
                    [3.6, 1.5],
                    [2.8, 0.2],
                    [1.3, 2.5],
                    [0.4, 3.2],
                    [1.0, 3.3],
                    [2.8, 3.6],
                    [3.6, 2.8],
                    [3.8, 3]])
    dia = np.array([[2, 2],
                    [2.5, 3],
                    [3, 2],
                    [2, 2.3],
                    [5, 5],
                    [2, 5],
                    [0.5, 0.7],
                    [3, 5],
                    [5, 3],
                    [0.5, 0.5],
                    [2, 2],
                    [3, 2],
                    [4, 2]])
    height = np.array([0.14, 0.05, 0.09, 0.05, 0.05, 0.07, 0.05, 0.07, 0.06, 0.06, 0.03, 0.05, 0.07])
    # 凹凸の生成
    G = Gaussian()
    if len(pos) == len(dia) and len(pos) == len(height):
        mount_num = len(height)
        for i in range(mount_num):
            G.set_mount(pos[i,:], dia[i, :], height[i])
            Zs[i,:] = G.gaussian(z)

        sum = np.zeros(1600)
        for i in range(mount_num):
            sum = sum + (-1)**(i+1) * Zs[i,:]

        Z = sum
        shape = X.shape
        Z = Z.reshape(shape)

        #二次元正規分布をplot
        fig = plt.figure(figsize = (15, 15))
        ax = fig.add_subplot(111, projection='3d')

        ax.set_xlabel('X Label')
        ax.set_ylabel('Y Label')
        ax.set_zlabel('Z Label')
        ax.set_zlim(-0.4,0.4)

        point_x = np.array([X[5,5], X[35,35]])
        point_y = np.array([Y[5,5], Y[35,35]])
        point_z = np.array([Z[5,5]+0.1, Z[35,35]+0.1])
        ax.plot_surface(X, Y, Z, rstride=1, cstride=1, cmap=cm.jet)
        ax.scatter(point_x, point_y, point_z, s=100, marker="v", alpha=1)
        plt.show()
    else:
        print("\033[31m" + "Error!!: the size of three arrays are not the same.\n Check & modify it." + "\033[0m")
ただし,出来上がった正規分布はすべて正の値なので,凸しか表現できない.そこで☟のコードを使うことで,部分的にマイナス符号をつけて凹を表現する.
    for i in range(mount_num):
        sum = sum + (-1)**(i+1) * Zs[i,:]
様々な正規分布の和を取ることで,複雑な地形が表現できた.