【悲報】2022-03-01開発・メンテナンスが終了しました
かなしみ
HERE is stopping its engagement on Harp.gl starting 03/01/2022 in favour of a fully productised and production-grade integration of the harp.gl rendering engine into HERE Maps API for JavaScript (https://developer.here.com/develop/javascript-api) All 3D features and many more will be offered via HERE Maps API for JavaScript moving forward.
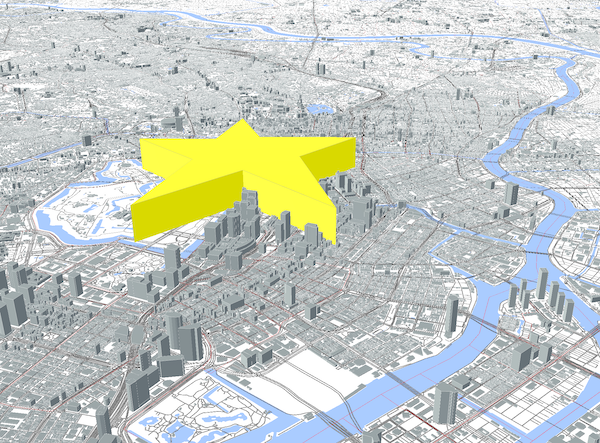
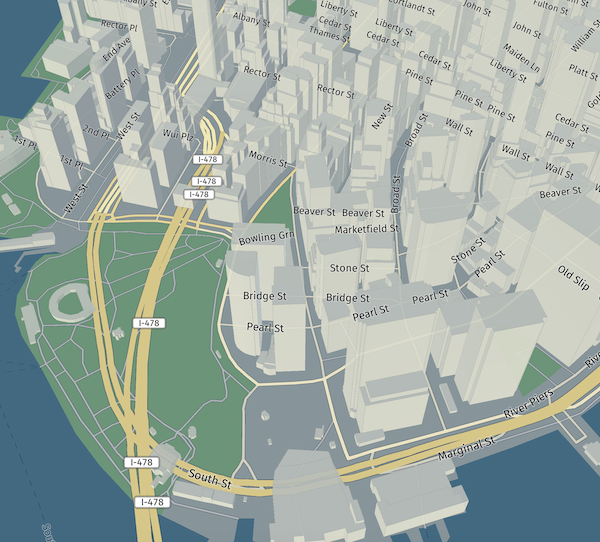
※GeoSaturday2020(2020/12/19)の成果物
※©︎OpenStreetMap Contributors
※OSMベクタータイルを使用(星はGeoJSON)
TL;DR
- わたしがいろいろいじったサンプルページ、サンプルコード
- 公式サンプル集
- Here社がメンテナンスしているオープンソースの3D地図ライブラリ「harp.gl」はまだ開発途上と思われるが、期待大!
- MapboxVectorTileを読み込めるので、既存のエコシステムと矛盾しない(styleは考えなければならないが)
はじめに
MapboxVectorTile(以下ベクタータイル)はMapbox社が定義・開発したオープンな規格です。様々な地図ライブラリがベクタータイルの描画に対応してきていますが、それでも、Mapbox GL JSが最も優れた選択肢だったと言えます。
そんななか、Here社が開発するharp.glというオープンソースライブラリの存在を知り、サンプルページを見てみるととても面白そうな見栄えです。色んなデータを表示してみたい!と思ったのですが、まだ開発途上ゆえほとんど情報がなく、ドキュメントもまだ洗練されていないようでした。
動かした印象では、Mapbox GL JSに劣らないポテンシャルを秘めていると思います。ということで、harp.glを応援したい・広めたいという気持ちから、本記事では、任意のベクタータイルやGeoJSONを読み込み・スタイリング・描画するサンプルを示します。
harp.glプロジェクト生成
harp.glはプロジェクト構成が少し独特です。Vue.jsなどのウェブフレームワークで使うには少し工夫が必要です(手元では環境構築出来ているので、別途記事にする予定)。なのでまずは、公式が提供しているプロジェクトテンプレートを利用します。
まずディレクトリを生成
mkdir harp.gl-example && cd harp.gl-example
プロジェクトを生成
npx -p yo -p @here/generator-harp.gl yo @here/harp.gl
対話式でいくつか選択します
- プロジェクト名
- TypeScriptかJavascriptか
- HereのAPI-key
全部エンターキーで問題なしです(Hereの地図データを使うなら当然API-keyを入れます)。すると以下のような構成のプロジェクトが生成されます。
.
├── README.md
├── View.ts
├── decoder.ts
├── index.html
├── index.ts
├── node_modules
├── package-lock.json
├── package.json
├── resources
├── tsconfig.json
└── webpack.config.js
API-keyを入れていれば、npm startで地図表示が出来ます。
サードパーティのベクタータイルを表示する
APIFormatについて
harp.glが対応しているベクタータイルの配信形式は以下ページでわかります
パッと見わかりにくいですが、TomtomV1というAPIFormatが/{z}/{x}/{y}.pbfという、慣れ親しんだ形式になります。
任意のタイルでVectorTileDataSourceを生成する
harp.glでは、ベクタータイルデータをVectorTileDataSourceクラスで取り扱います。./View.tsで、VectorTileDataSourceは以下のとおり定義されています。
//10行目
import { VectorTileDataSource } from '@here/harp-vectortile-datasource';

//38行目
const dataSource = new VectorTileDataSource({
    authenticationCode: '<Here-API-key>',
});
これを以下に置き換えます
// 10行目
import { VectorTileDataSource, APIFormat } from '@here/harp-vectortile-datasource';

// 38行目
const dataSource = new VectorTileDataSource({
    baseUrl: 'https://tile.openstreetmap.jp/data/japan',
    apiFormat: APIFormat.TomtomV1,
    styleSetName: 'sample',
});
baseUrlにはタイルのURLを入れます。タイルのURLがhttps://tile.openstreetmap.jp/data/japan/{z}/{x}/{y}.pbfなら
baseUrlはhttps://tile.openstreetmap.jp/data/japanとなります。
apiFormatは先ほど確認したとおりTomtomV1を指定。styleSetNameは後述。
スタイルを定義する
スタイルはMapboxと似たような書式ですが、スキーマは大幅に異なります。公式で、スタイルをいじりながら表示を確認出来るページが用意されているので、こちらを見てみましょう。
スタイルは./index.tsで定義します。
// interfaceをimportしておくこおとでコード補完の恩恵を受けられる
import { Theme } from '@here/harp-datasource-protocol';

// transportationレイヤーを表示してみる
const theme: Theme = {
    styles: {
        sample: [
            {
                id: 'road',
                layer: 'transportation',
                technique: 'solid-line',
                lineColor: '#ff0000',
                lineWidth: [
                    'interpolate',
                    ['linear'],
                    ['zoom'],
                    4,
                    1000,
                    10,
                    100,
                    14,
                    10,
                    16,
                    2,
                ],
            },
        ],
    },
};
// appでthemeを指定する
const app = new View({
    canvas: document.getElementById("map") as HTMLCanvasElement,
    theme: theme,
});
// カメラの初期値を東京駅にしてみる
mapView.lookAt({
    target: new GeoCoordinates(35.6809591, 139.7673068),
    zoomLevel: 10,
    tilt: 40,
});
これでnpm startしてみましょう。
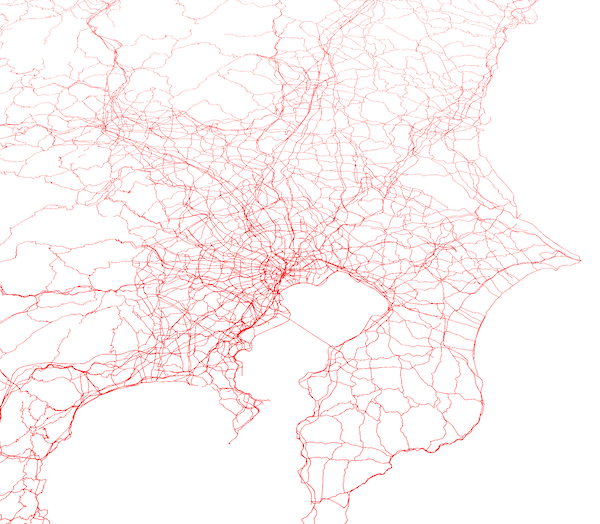
このように、OSMベクタータイルから、transportationレイヤーが表示されました。では次に建物ポリゴンを3D表示してみましょう。
3D表示する際のスタイル定義は以下です。
{
    id: 'extrudedBuildings',
    description: 'extruded buildings',
    technique: 'extruded-polygon',
    layer: 'building',
    minZoomLevel: 14,
    renderOrder: 2000,
    height: ['get', 'render_height'], // render_heightプロパティを取得
    color: '#ffffff',
    roughness: 1,
    metalness: 0.8,
    emissive: '#78858C',
    emissiveIntensity: 0.85,
    footprint: true,
    maxSlope: 0.8799999999999999,
    lineWidth: 1,
    lineColor: '#ffffff',
    lineColorMix: 0.6,
    fadeNear: 0.9,
    fadeFar: 1,
    lineFadeNear: -0.75,
    lineFadeFar: 1,
}
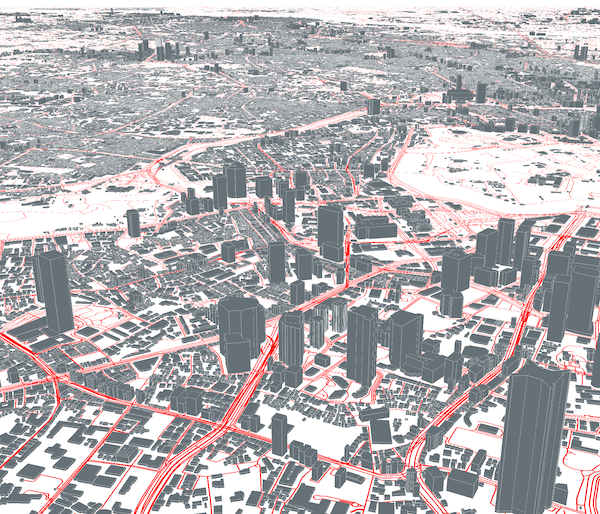
これを、上述のtheme内、styles-sample以下の配列に追加します。そしてブラウザで再表示して、ある程度地表面にズームすると、以下のように3D地物が表示されます。
空も表示出来るぞ!
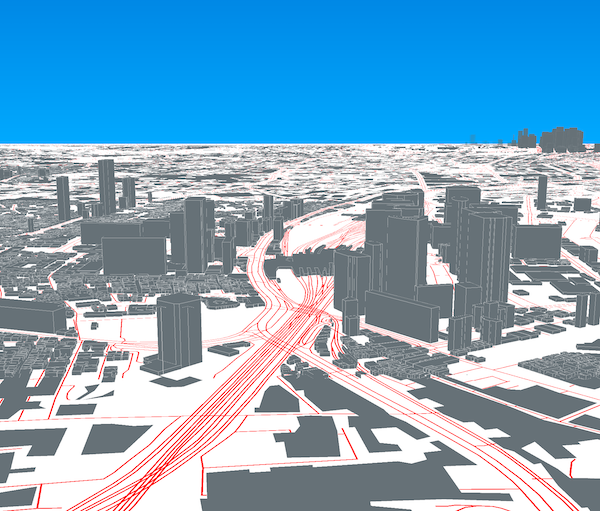
上記のスクリーンショットでは、地平線より上、つまり空が真っ白で味気ないです(某ライブラリのv2でも空の描画に対応してたっけ…)。harp.glでも空の描画が可能です。
const theme: Theme = {
    styles: {
        sample: [
        // 略
        ],
    },
    // 以下を追加
    sky: {
        type: 'gradient',
        topColor: '#002299',
        bottomColor: '#00aaff',
        groundColor: '#88aadd',
        monomialPower: 1,
    },
};
するとこうなる
感想
いかがですか?やばくないですか?
私は可能性を大いに感じており、Mapbox GL JSに並ぶすばらしいライブラリになるのではないかと考えております。
また、既存のベクタータイル資産がそのまま活用出来るのも素晴らしいですね。残る課題はスタイルです。Mapbox Styleそのままでは使えないので、その変換が出来ないか実験中です。
そんな訳でharp.gl、今後もチェックしていきます。
