PandasやSeabornを使ってデータ分析に取り組む際、どのようなことをするべきか・どの値をチェックするべきなのかを私なりにセオリー化してみましたので紹介します。「Python2年生 データ分析のしくみ」を参考に統計量とペアプロットを活用したデータラングリングになります。
ペンギンデータ
データ分析の用例として、Palmer Station Antarctica LTERによって取集されたパーマーペンギンの分類と各種説明変数を集めたデータを用いてます。データのCSVファイルはここから入手できます。
データの仕様をチェック
データ分析を始める際まず真っ先にやるべきなのが、先頭5行のデータを見るのとデータの仕様をチェックすることです。具体的にはデータがどのような内容か直感的に理解するのと、データ型とコラム名・コラム数、インデックス名・インデックス数、等々を明確にする必要があります。
# 以下のライブラリを使用
import numpy as np
import pandas as pd
import datetime

# 可視化ライブラリ
import matplotlib.pyplot as plt
import seaborn as sns
sns.set()
%matplotlib inline

# 小数第3位までを表示
%precision 3

df = pd.read_csv("penguins.csv", encoding = "UTF-8")
print("先頭5行のデータを見る")
df.head()
先頭5行のデータを見る

rowid	species	island	bill_length_mm	bill_depth_mm	flipper_length_mm	body_mass_g	sex	year
0	1	Adelie	Torgersen	39.1	18.7	181.0	3750.0	male	2007
1	2	Adelie	Torgersen	39.5	17.4	186.0	3800.0	female	2007
2	3	Adelie	Torgersen	40.3	18.0	195.0	3250.0	female	2007
3	4	Adelie	Torgersen	NaN	NaN	NaN	NaN	NaN	2007
4	5	Adelie	Torgersen	36.7	19.3	193.0	3450.0	female	2007
#データの仕様をチェック
#列名・インデックス名をリストにする
list_columns = [i for i in df.columns]
list_index = [i for i in df.index]

print("データのコラム名・コラム数、インデックス名・インデックス数を確認する")

print("\nコラム名")
print(list_columns)
print("\nコラム数")
print(len(list_columns))

print("\nインデックス名")
print(list_index)
print("\nインデックス数")
print(len(list_index))

print("データのデータ型を検証")
print(df.dtypes)
データのコラム名・コラム数、インデックス名・インデックス数を確認する

コラム名
['rowid', 'species', 'island', 'bill_length_mm', 'bill_depth_mm', 'flipper_length_mm', 'body_mass_g', 'sex', 'year']

コラム数
9

インデックス名
[0, 1, 2, 3, 4, 5, 6, 7, 8, 9, 10, 11, 12, 13, 14, 15, 16, 17, 18, 19, 20, 21, 22, 23, 24, 25, 26, 27, 28, 29, 30, 31, 32, 33, 34, 35, 36, 37, 38, 39, 40, 41, 42, 43, 44, 45, 46, 47, 48, 49, 50, 51, 52, 53, 54, 55, 56, 57, 58, 59, 60, 61, 62, 63, 64, 65, 66, 67, 68, 69, 70, 71, 72, 73, 74, 75, 76, 77, 78, 79, 80, 81, 82, 83, 84, 85, 86, 87, 88, 89, 90, 91, 92, 93, 94, 95, 96, 97, 98, 99, 100, 101, 102, 103, 104, 105, 106, 107, 108, 109, 110, 111, 112, 113, 114, 115, 116, 117, 118, 119, 120, 121, 122, 123, 124, 125, 126, 127, 128, 129, 130, 131, 132, 133, 134, 135, 136, 137, 138, 139, 140, 141, 142, 143, 144, 145, 146, 147, 148, 149, 150, 151, 152, 153, 154, 155, 156, 157, 158, 159, 160, 161, 162, 163, 164, 165, 166, 167, 168, 169, 170, 171, 172, 173, 174, 175, 176, 177, 178, 179, 180, 181, 182, 183, 184, 185, 186, 187, 188, 189, 190, 191, 192, 193, 194, 195, 196, 197, 198, 199, 200, 201, 202, 203, 204, 205, 206, 207, 208, 209, 210, 211, 212, 213, 214, 215, 216, 217, 218, 219, 220, 221, 222, 223, 224, 225, 226, 227, 228, 229, 230, 231, 232, 233, 234, 235, 236, 237, 238, 239, 240, 241, 242, 243, 244, 245, 246, 247, 248, 249, 250, 251, 252, 253, 254, 255, 256, 257, 258, 259, 260, 261, 262, 263, 264, 265, 266, 267, 268, 269, 270, 271, 272, 273, 274, 275, 276, 277, 278, 279, 280, 281, 282, 283, 284, 285, 286, 287, 288, 289, 290, 291, 292, 293, 294, 295, 296, 297, 298, 299, 300, 301, 302, 303, 304, 305, 306, 307, 308, 309, 310, 311, 312, 313, 314, 315, 316, 317, 318, 319, 320, 321, 322, 323, 324, 325, 326, 327, 328, 329, 330, 331, 332, 333, 334, 335, 336, 337, 338, 339, 340, 341, 342, 343]

インデックス数
344
データのデータ型を検証
rowid                  int64
species               object
island                object
bill_length_mm       float64
bill_depth_mm        float64
flipper_length_mm    float64
body_mass_g          float64
sex                   object
year
データの要約統計量・欠損値の度数を算出
次にデータの要約統計量・欠損値の度数を算出します。量的変数がメインとなるデータの場合全体的にどのような値を示しているか、欠損値の度数は分析に影響を及ぼさないか等々が確認できます。
# 要約統計量を活用したデータラングリング
print("\nデータの要約統計量を算出")
print(df.describe())

print("\nデータの欠損値の度数")
print(df.isnull().sum())
データの要約統計量を算出
            rowid  bill_length_mm  bill_depth_mm  flipper_length_mm  \
count  344.000000      342.000000     342.000000         342.000000
mean   172.500000       43.921930      17.151170         200.915205
std     99.448479        5.459584       1.974793          14.061714
min      1.000000       32.100000      13.100000         172.000000
25%     86.750000       39.225000      15.600000         190.000000
50%    172.500000       44.450000      17.300000         197.000000
75%    258.250000       48.500000      18.700000         213.000000
max    344.000000       59.600000      21.500000         231.000000

       body_mass_g         year
count   342.000000   344.000000
mean   4201.754386  2008.029070
std     801.954536     0.818356
min    2700.000000  2007.000000
25%    3550.000000  2007.000000
50%    4050.000000  2008.000000
75%    4750.000000  2009.000000
max    6300.000000  2009.000000

データの欠損値の度数
rowid                 0
species               0
island                0
bill_length_mm        2
bill_depth_mm         2
flipper_length_mm     2
body_mass_g           2
sex                  11
year                  0
dtype: int64
データ可視化(ペアプロット)を活用したデータラングリング
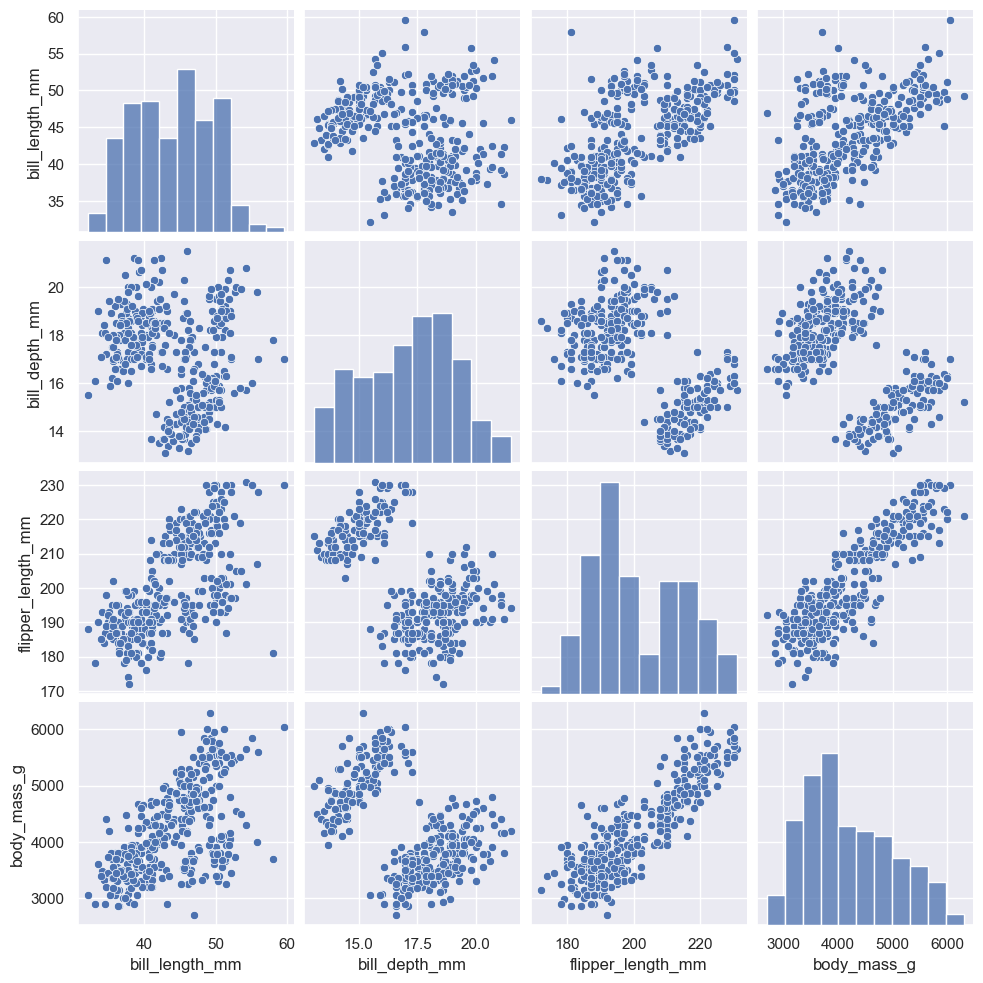
量的変数の関係をpairplot`メソッドをつかったペアプロットとすると非常に便利です。データの関係が視覚的に分かりやすくなるだけでなく、質的変数による確率種の違いがあるか等々を検討することができます。
また散布図に対応する回帰直線やカーネル密度分布・等高線を描くことでデータの予測に有効なモデルの検討に役立てられます。
#データの分布を可視化
#必要ないデータを排除したデータフレームを作成する

df_new = df[["bill_length_mm","bill_depth_mm","flipper_length_mm", "body_mass_g","species","sex"]]

#ペアプロットで2データの散布図・データ自体の度数分布を可視化する
sns.pairplot(df_new)
引数にkind="reg"を指定すると各2データ間の回帰直線とその95%信頼区間を描写できます。今回の場合、95%信頼区間に一致するデータはほぼ存在しないことが分かるので、少なくともパルマーペンギンのデータの予測に回帰直線のモデルは適していないことが分かります。
#ペアプロットで2データの散布図・データ自体の度数分布を可視化する
sns.pairplot(df_new, kind="reg")
引数にhue="species"を指定するとパルマーペンギンの散布図をカテゴリーごと色で分けられる他、カーネル密度分布を使った確率密度分布を視覚化できます。これはカテゴリーごとに確率種が異なっているかを検定するのに役立ちます。
#ペアプロットで2データの散布図・データ自体の度数分布を可視化する
sns.pairplot(df_new, hue="species")
kind="kde"と指定すると2次元データ上のデータが属している割合を10%ごとに等高線で表示することができます。2データの確率密度分布を2次元データ上に投影したものとなっています。
#ペアプロットで2データの散布図・データ自体の度数分布を可視化する
sns.pairplot(df_new, kind="kde")
#ペアプロットで2データの散布図・データ自体の度数分布を可視化する
sns.pairplot(df_new, hue="species", kind="kde")


