Odyssey CBTのPython3 エンジニア認定データ分析試験の学習を始めました。今回はScikitLearnで決定木・ランダムフォレスト法を使った機械学習について学びました。
決定木の基礎知識
決定木は情報を木構造を使って分類し、機械学習の指標に情報利得(親ノードの不純度 - 子ノードの不純度の合計)を計算する機械学習のアルゴリズムです。情報利得・不順度の計算にはジニ不純度・エントロピー・分類誤差の指標が等々が用いられます。今回はジニ不純度を使って決定木を生成します。
ジニ不純度と情報利得
ジニ不純度とはノードに誤ったクラスが振り分けられてしまう確率を表します。例えばクラス0となる確率が0.6、クラス1となる確率が0.4、の場合、ジニ不順度は0.48となります。**決定木の目的はジニ不純度をなるべく減らし誤分類が行われる確率を極限まで下げる(情報利得を上げる)**ことです。
- ジニ不純度の計算(C - クラス数, P(c) -確率)
$$
G = \sum_{c=0}^{C-1}P(c)^2 \quad
$$
情報利得が正となる場合、木の分割はジニ不純度を減らすので正しい分割となります。
逆に負となる場合は分割を減らしたほうがよいことが分かります。情報利得を増やすための決定木は、このように明示的なアルゴリズムで生成することができます。
今回はirisデータセットを3クラスに分類しそのグラフを生成してみます。
#irisデータを3クラスに分類
from sklearn.datasets import load_iris
from sklearn.model_selection import train_test_split
from sklearn.tree import DecisionTreeClassifier

iris = load_iris()
X,y = iris.data, iris.target

#学習データ・テストデータに分類
X_train, X_test, y_train, y_test= train_test_split(X,y,test_size=0.25,random_state=123)

#決定木のインスタンス - 最大深度は3、ランダムに生成する
tree = DecisionTreeClassifier(max_depth=3, random_state=123)

#学習
tree.fit(X_train, y_train)
pydotplus・graghvizで可視化
生成した決定機を視覚化するにはpydotplus・graghvizで可視化する必要があります。pydotplusはpipでインストールできる他、graghvizのexeファイルを手動でインストールしパスを指定する必要があります。
- graghvizのインストール
#pydotplusを用いて決定木を視覚化する
!pip install pydotplus

#pydotplus・graghvizで可視化
from pydotplus import graph_from_dot_data
from sklearn.tree import export_graphviz

dot_data = export_graphviz(tree, filled=True, rounded = True, class_names=["Setosa", "Versicolor", "Virginica"], feature_names=["Sepal Length","Sepal Width","Petal Length","Petal Width"], out_file=None)

#グラフを出力
graph = graph_from_dot_data(dot_data)
graph.progs = {'dot': u"C:\\Program Files\\Graphviz\\bin\\dot.exe"}
graph.write_png("Iris_tree.png")
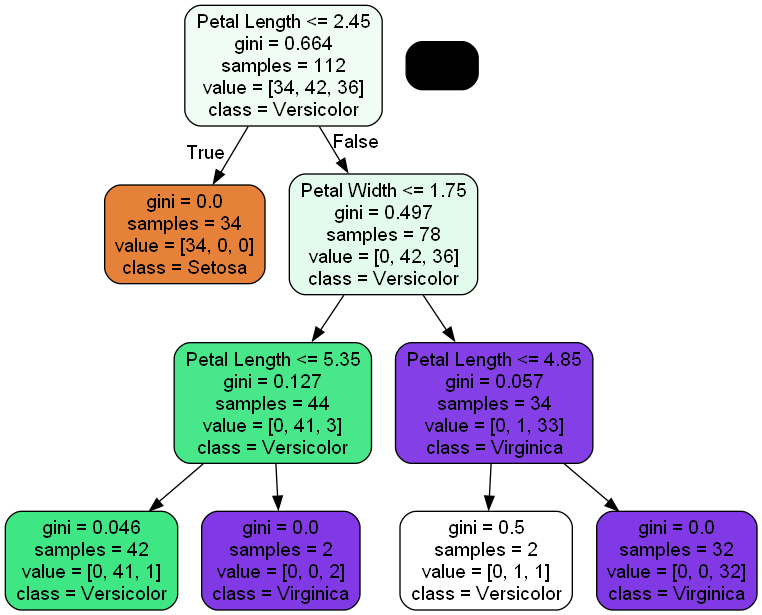
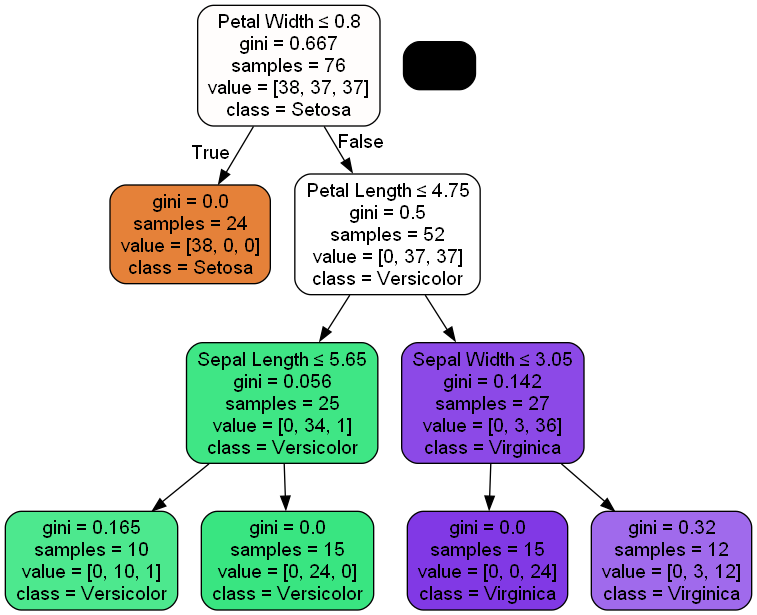
分類の基準としてまず花弁の幅が1.75cm以下であればSetosa, 次に花弁の長さが4.85cm以下ならVirginica・4.85~5.35cmの間であればVersicolorであると分類されます。SVM・ニューラルネットワークほど正確な分類はできませんが、「明確に2つに分割するタスクを繰り返す」という直感的なデータ分析ができます。
#決定木を使った予測・スコア(パーセンテージ)
y_pred = tree.predict(X_test)
print(y_pred)

#score - 汎用性能・テスト性能を測る
y_train_score = tree.score(X_train,y_train)
print("Train Score: ", y_train_score)

y_test_score = tree.score(X_test,y_test)
print("Test Score: ", y_test_score)
[1 2 2 1 0 1 1 0 0 1 2 0 1 2 2 2 0 0 1 0 0 1 0 2 0 0 0 2 2 0 2 1 0 0 1 1 2
 0]
Train Score:  0.9821428571428571
Test Score:  0.9210526315789473
ランダムフォレスト法による分類
データをランダムに分割して決定木の作成を繰り返し、推定結果の多数決・平均値を求めます。これはアンサンブル学習と呼ばれています。たいていの場合、ランダムフォレスト法の方が決定木よりも分類精度が高くなります。
#RandomForestClassifier - 決定木を100個制作してアンサンブル学習を施す

from sklearn.ensemble import RandomForestClassifier
forest = RandomForestClassifier(n_estimators=100,      # 決定木の数
                                criterion='gini',      # 不純度評価指標(ジニ係数)
                                max_depth=10,           # 木の深さ
                                min_samples_leaf=10,    # 1ノードの最小クラス数
                                max_features='auto')   # 最大特徴量数

#学習
forest.fit(X_train, y_train)
array([1, 2, 2, 1, 0, 1, 1, 0, 0, 1, 2, 0, 1, 2, 2, 2, 0, 0, 1, 0, 0, 1, 0, 2, 0, 0, 0, 2, 2, 0, 2, 1, 0, 0, 1, 1, 2, 0])
#RandomForestClassifier - 決定木を100個制作してアンサンブル学習を施す
from sklearn.ensemble import RandomForestClassifier
forest = RandomForestClassifier(n_estimators=100,      # 決定木の数
                                criterion='gini',      # 不純度評価指標(ジニ係数)
                                max_depth=10,           # 木の深さ
                                min_samples_leaf=10,    # 1ノードの最小クラス数
                                max_features='auto')   # 最大特徴量数

#学習
forest.fit(X_train, y_train)

# 決定木の一つを視覚化する
estimators = forest.estimators_
dot_data = export_graphviz(estimators[0], # 決定木オブジェクト
                                out_file=None, # ファイルは介さずにGraphvizにdot言語データを渡す
                                filled=True, # 分岐の際にどちらのノードに多く分類されたか
                                rounded=True, # ノードの角を丸く描画
                                class_names=["Setosa", "Versicolor", "Virginica"], #クラス名
                                feature_names=["Sepal Length","Sepal Width","Petal Length","Petal Width"], #説明変数
                                special_characters=True # 特殊文字を扱える
                               )

graph = graph_from_dot_data(dot_data)
file_name = "RandomForest_visualization.png"
graph.write_png(file_name)

#決定木を使った予測・スコア(パーセンテージ)
y_pred = forest.predict(X_test)
print(y_pred)

#score - 汎用性能・テスト性能を測る
y_train_score = forest.score(X_train,y_train)
print("Train Score: ", y_train_score)

y_test_score = forest.score(X_test,y_test)
print("Test Score: ", y_test_score)
[1 2 2 1 0 2 1 0 0 1 2 0 1 2 2 2 0 0 1 0 0 1 0 2 0 0 0 2 2 0 2 1 0 0 1 1 2
 0]
Train Score:  0.9553571428571429
Test Score:  0.9473684210526315
ハイパーパラメータ(最大深度)の検証(※2023/05/22、更新)
機械学習のアルゴリズムには、学習に用いる指標を更に自動で更新できるようにするハイパーパラメーターという指標があります。今回は決定木のハイパーパラメーター(最大深度)を**グリッドサーチ(Grid Search)**という手法で最適化する方法を考えます。
#決定木のグリッドサーチ
#irisをデータセットに用い、決定木をグリッドサーチで最適化する
from sklearn.datasets import load_iris
from sklearn.tree import DecisionTreeClassifier
from sklearn.model_selection import train_test_split, GridSearchCV

#irisデータを読み込み
iris = load_iris()
X,y = iris.data, iris.target

#train_test_split - 教師あり学習用のデータを学習用・テスト用に分割する
X_train, X_test, y_train, y_test = train_test_split(X, y, test_size=0.3, random_state=123)

#決定木のインスタンス
tree = DecisionTreeClassifier(random_state=123)

#グリッドサーチ - 決定木の最大深度の内、どれが最適かを検証する
param_grid={"max_depth":[3,4,5,6,7,8,9,10]}

#学習
tree.fit(X_train, y_train)

#グリッドサーチ - 交差検証を10回
cv = GridSearchCV(tree, param_grid=param_grid, cv=10)
cv.fit(X_train, y_train)

#テストデータの予測開始
y_pred = tree.predict(X_test)
#決定木を使った予測
print("Predict Results: ",y_pred)

#最適なパラメータ・モデルを表示
print("Best Parameter: ", cv.best_params_)
print("Best Model: ", cv.best_estimator_)

#汎用性能・テスト性能を測る
y_train_score = tree.score(X_train,y_train)
print("Train Score: ", y_train_score)

y_test_score = tree.score(X_test,y_test)
print("Test Score: ", y_test_score)
#最適なパラメータ・モデルを推定する
Predict Results:  [1 2 2 1 0 2 1 0 0 1 2 0 1 2 2 2 0 0 1 0 0 1 0 2 0 0 0 2 2 0 2 1 0 0 1 1 2 0 0 1 1 0 2 2 2]

Best Parameter:  {'max_depth': 3}
Best Model:  DecisionTreeClassifier(max_depth=3, random_state=123)

Train Score:  1.0
Test Score:  0.9555555555555556
決定木・ランダムフォレスト法が完璧に理解できました。
次回は回帰分析のアルゴリズムと次元圧縮について学習します。

