はじめに
こんにちは!Life is Tech ! メンターのKentyです。
今日は Life is Tech ! メンターによるAdvent Calendar 2日目!他分野で活躍するメンターの記事が読めると思うとワクワクします!昨日はつよつよどぎーが「プログラミング学習で「何が分からないか分からない」を解消するために試してきた7つのこと」についての記事を出しているのでまだの方はチェックしてみてください!
さて、今回はビルボード1位やグラミー賞ノミネートなど、世界的な人気を誇る韓国発の7人組ヒップホップグループBTS(防弾少年団)をSpotify APIの楽曲データを使って魅力を探っていきます。欧米のアーティストはもとより、K-POPのアーティストは何百といる中で、何が彼らを際立たせているのだろうか。データの力を借りながら見ていきましょう。
データ収集
以下のコードでSpotify APIからBTSの楽曲データを出力しました。OAuth認証に必要な情報を取得するにはアプリの作成が必要です。(Spotify のプレミアム会員である必要があります) spotify_urlはSpotifyのアーティストページのURLを代入します。
import spotipy
import pandas as pd
from spotipy.oauth2 import SpotifyClientCredentials

my_id = ''
secret_key = ''
client_credentials_manager = SpotifyClientCredentials(client_id=my_id, client_secret=secret_key)
sp = spotipy.Spotify(client_credentials_manager=client_credentials_manager)
spotify_url = 'https://open.spotify.com/artist/3Nrfpe0tUJi4K4DXYWgMUX'
feature_list = []
artist_albums = sp.artist_albums(artist_id=spotify_url, limit=50)

for album_index in range(len(artist_albums['items'])):
    album_uri = artist_albums['items'][album_index]['uri']
    album_tracks = sp.album_tracks(album_uri)
    for track_index in range(len(album_tracks['items'])):
        album_song = album_tracks['items'][track_index]['uri']
        audio_features = sp.audio_features(album_song)
        title = album_tracks['items'][track_index]['name']
        popularity = sp.track(album_tracks['items'][track_index]['external_urls']['spotify'])['popularity']
        for feature in audio_features:
            feature_list.append(
                [popularity, feature['danceability'], feature['energy'], feature['key'], feature['speechiness'],
                 feature['acousticness'], feature['instrumentalness'], feature['liveness'], feature['valence'],
                 feature['tempo'], feature['duration_ms'], feature['time_signature'],
                 artist_albums['items'][0]['artists'][0]['name'], artist_albums['items'][album_index]['release_date'],
                 album_tracks['items'][track_index]['name']])

data = pd.DataFrame(feature_list, columns=['popularity', 'danceability', 'energy', 'key', 'speechiness', 'acousticness',
                                           'instrumentalness', 'liveness', 'valence', 'tempo', 'duration_ms',
                                           'time_signature', 'artist_name', 'release_date', 'song_name'])
data.to_csv('export/raw/bts_spotify_features.csv')
また、アルバムから楽曲を取得しているため、同じ曲、〇〇ver,remix等は以下で排除していきます。
import pandas as pd

df = pd.read_csv('export/raw/bts_spotify_features.csv')
df = df.sort_values(by='release_date', ascending=False)
df = df[df["song_name"].str.contains("ver|feat|mix|edition|remix|acoustic|instrumental|skit", case=False) == False]
df = df.drop_duplicates(subset=['song_name'], keep='last')
df.to_csv('export/clean/bts_spotify_features_clean.csv')
その結果2013/06/12~2022/11/20の間で配信された516曲を取得することができました。

データ項目
| 指標 | 説明 |
|---|---|
| popularity | 相対的人気度(0~100) |
| danceability | 踊れる曲かどうか(0~1) |
| energy | エネルギッシュさ(0~1) |
| speechiness | 言葉がどれくらい入っているか(0~1) |
| acousticness | アコースティック感(0~1) |
| instrumentalness | インスト感(歌声が入っていない/0~1) |
| liveness | ライブ感(聴衆がいるか)(0~1/0.8以上でライブ判定) |
| valence | 悲観的(0)~楽観的(1) |
| tempo | テンポ(40-200bpm) |
代表的な指標を抜粋しています。詳細は Spotify for Developers | Get Tracks' Audio Features をご覧ください。
例
Spotify APIのデータが正しいかどうか違いがわかりやすいenergyで聴き比べてみましょう。
BTS Singularity energy=0.272
テテのダンスから醸し出されるエネルギーは0.2では到底収まらないぐらいすごい🌋
BTS War of Hormone energy=0.993
データ分析
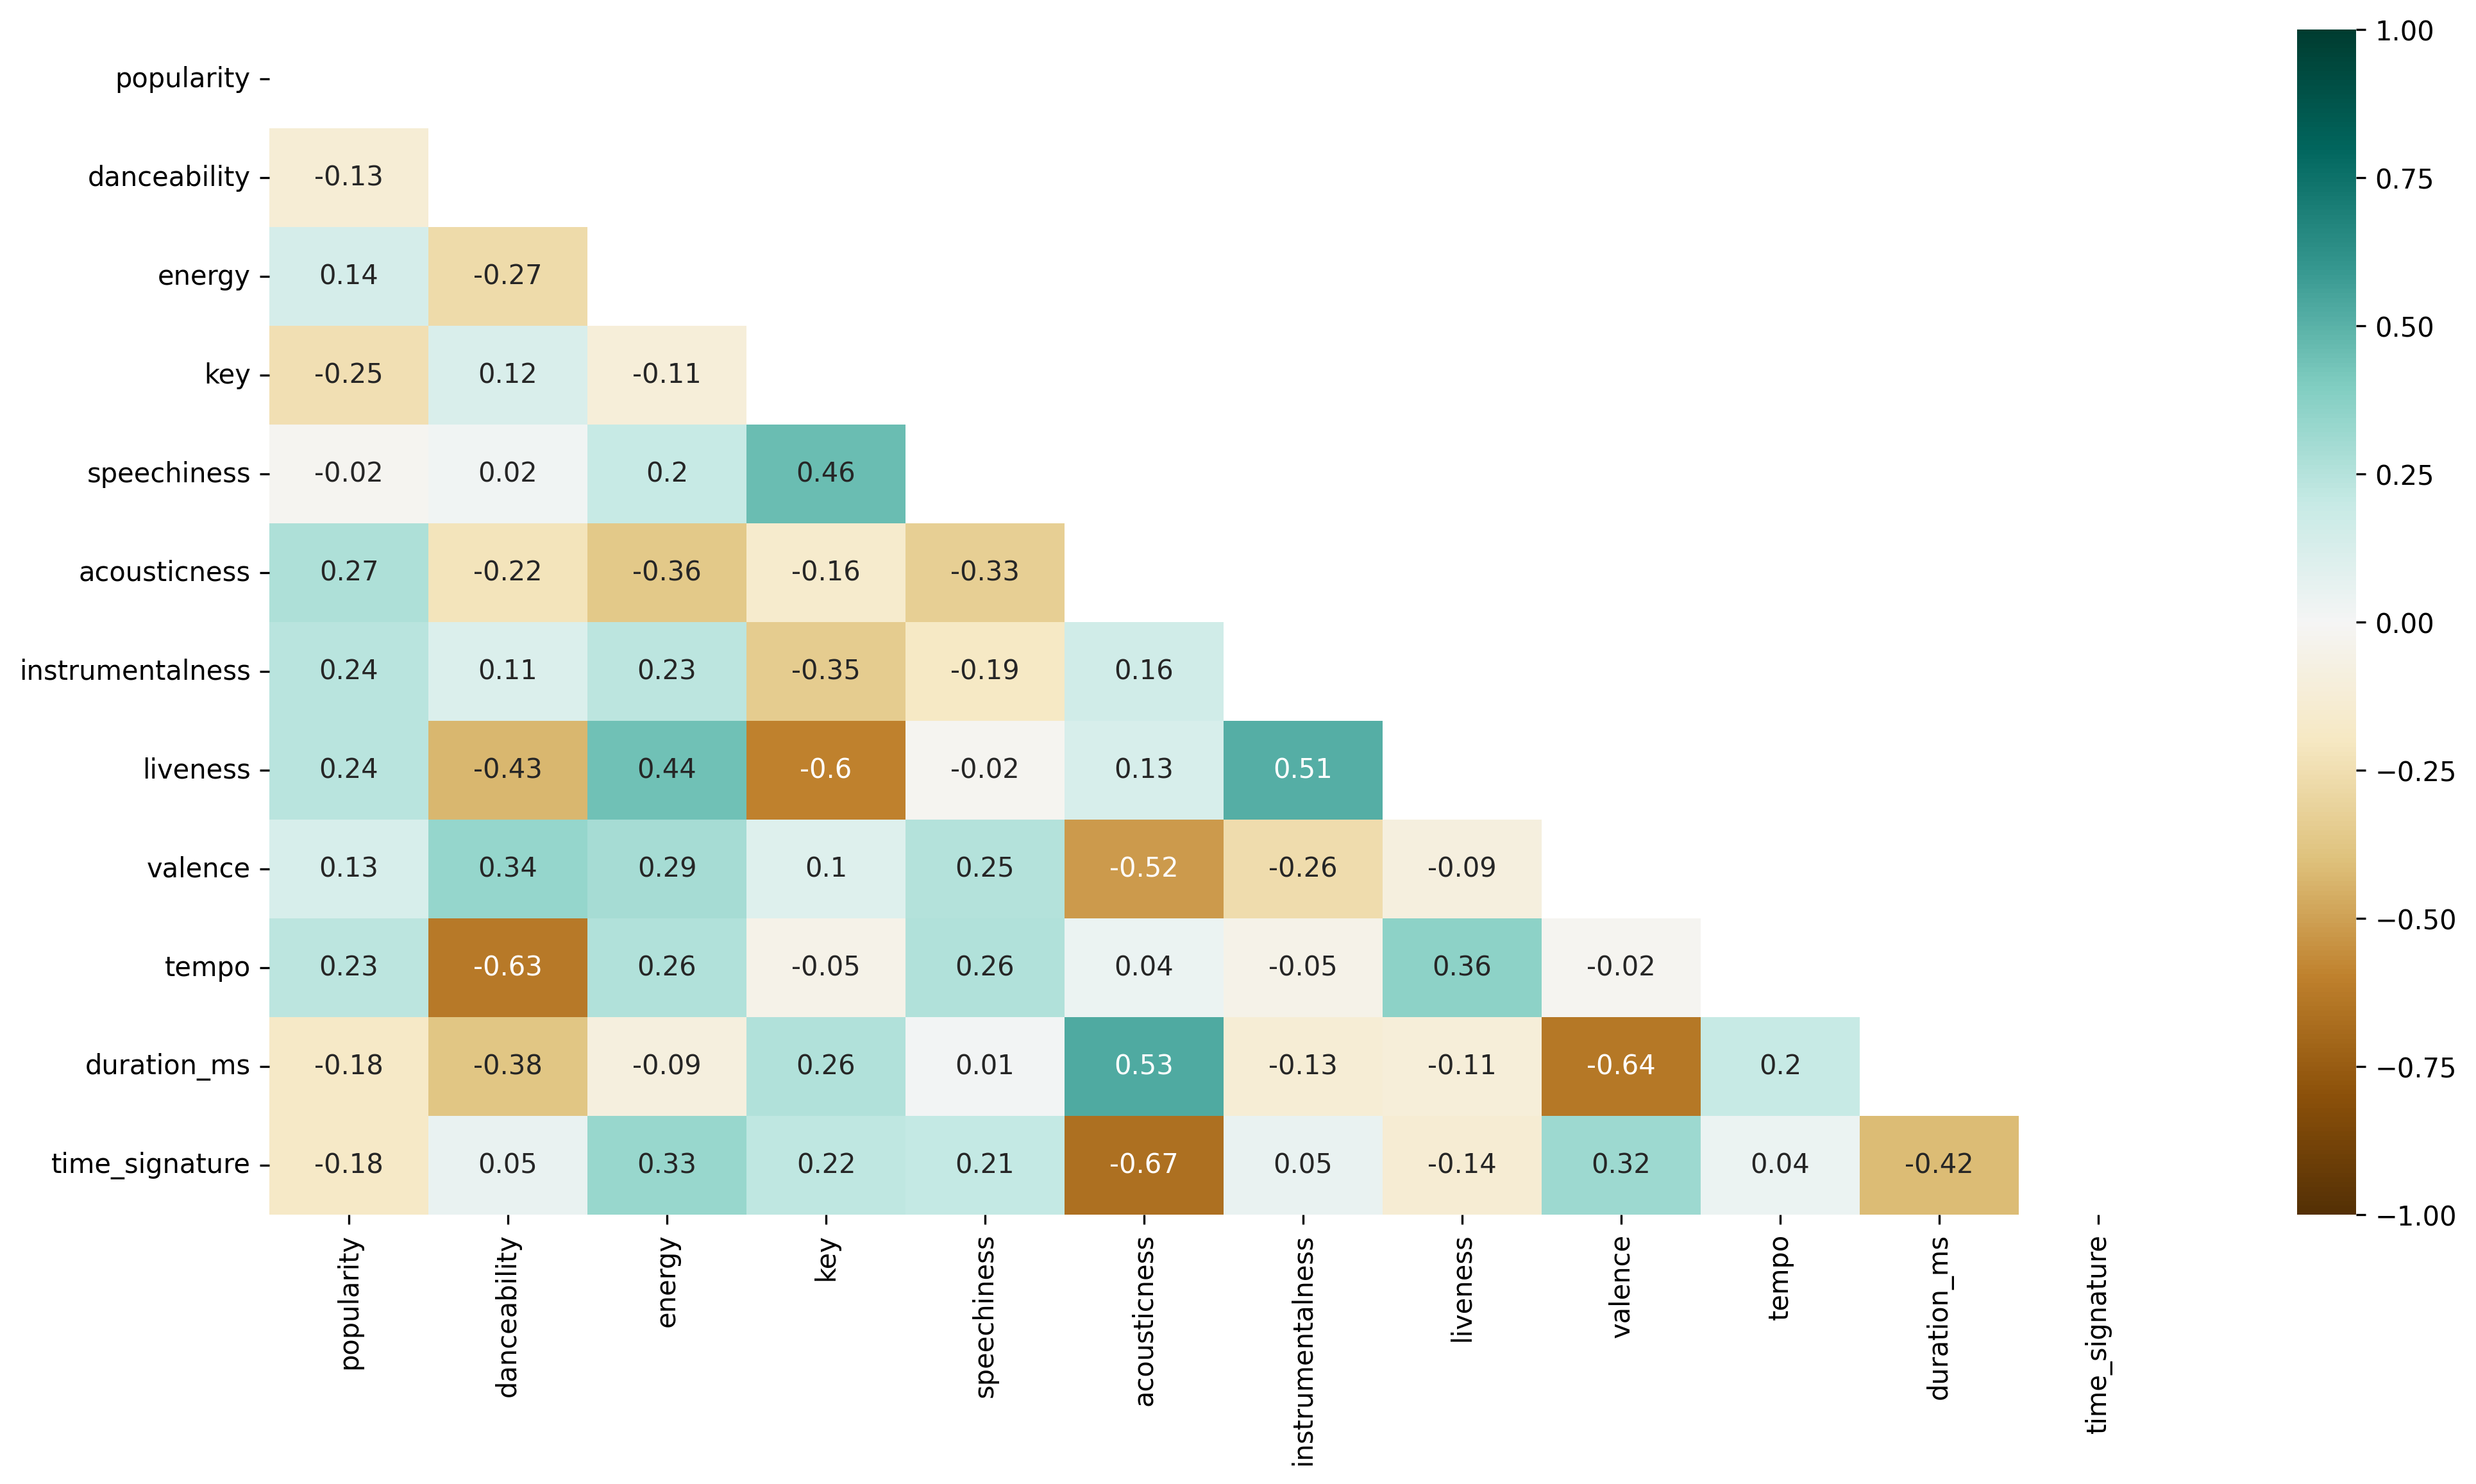
Popularityと指標の相関関係
   import numpy as np
   import pandas as pd
   import seaborn as sb
   import matplotlib.pyplot as plt

   df = pd.read_csv('export/clean/bts_spotify_features_clean.csv')
   corr_matrix = df.corr().round(2)
   matrix = np.triu(np.ones_like(corr_matrix))
   plt.figure(figsize=(16, 8))
   heatmap = sb.heatmap(corr_matrix, vmin=-1, vmax=1, cmap="BrBG", annot=True, mask=matrix)
   plt.savefig('export/image/heatmap.png', dpi=300, bbox_inches='tight')
Popularityと指標の相関係数ヒートマップです。Popularityは曲が配信日より時間が経つにつれ、下がる傾向があるため2020/11/20~2022/11/20の2年間で配信された曲で出力しています。弱い相関はあるものの際立つ指標はありませんでした。
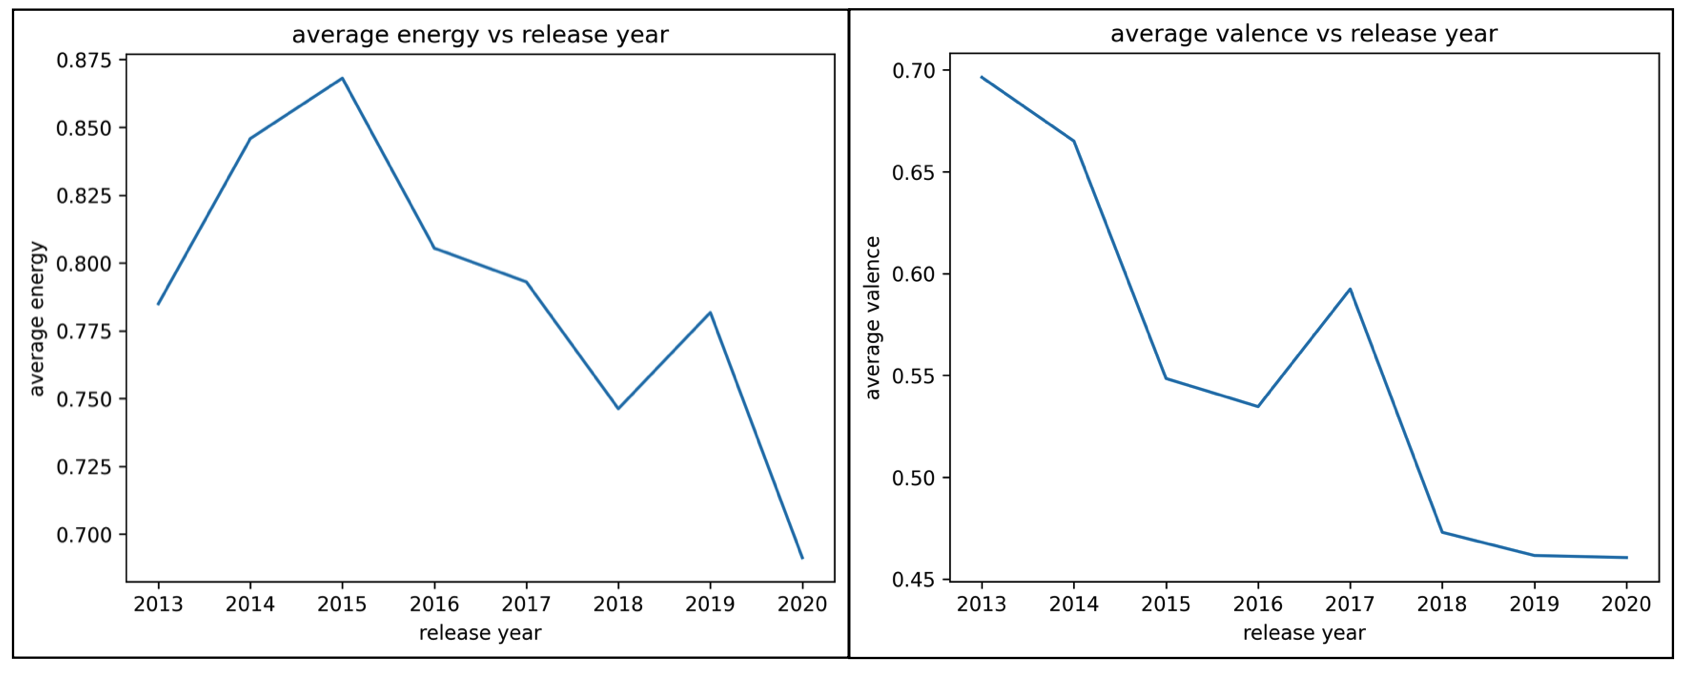
指標の年別平均推移
import pandas as pd
import matplotlib.pyplot as plt

df = pd.read_csv('export/bts_spotify_features_clean.csv')
df['release_date'] = pd.DatetimeIndex(df['release_date']).year
years = [2013,2014,2015,2016,2017,2018,2019,2020]
energy_mean = []
for year in years:
    energy_mean.append(df[df['release_date'] == year]['valence'].mean())
plt.plot(years,energy_mean)
plt.xlabel('release year')
plt.ylabel('average valence')
plt.title('average valence vs release year')
plt.savefig('export/valence.png', dpi=300, bbox_inches='tight')
デビュー当時はenergyとvalenceが平均的に高いですが、下落傾向があります。意識して調整している感じがするぐらいきれいにこの2つの指標のみ下がっています。
他のK-popグループとの比較(指標平均)
2022年度のBillboard 200 にランクインしたアーティストのデータを使用しています。
| artist | danceability | energy | key | speechiness | acousticness | instrumentalness | liveness | valence | tempo | duration_ms |
|---|---|---|---|---|---|---|---|---|---|---|
| bts | 0.63 | 0.79 | 5.09 | 0.15 | 0.14 | 0.02 | 0.18 | 0.56 | 120.45 | 220039.60 |
| straykids | 0.68 | 0.80 | 5.12 | 0.13 | 0.12 | 0.00 | 0.20 | 0.52 | 126.22 | 197586.34 |
| blackpink | 0.69 | 0.69 | 5.24 | 0.10 | 0.14 | 0.00 | 0.18 | 0.58 | 120.32 | 189383.40 |
| twice | 0.70 | 0.80 | 5.69 | 0.08 | 0.17 | 0.00 | 0.19 | 0.63 | 125.30 | 201752.71 |
| txt | 0.58 | 0.59 | 4.92 | 0.08 | 0.31 | 0.16 | 0.17 | 0.44 | 115.72 | 189490.24 |
| nct127 | 0.67 | 0.76 | 4.85 | 0.10 | 0.16 | 0.03 | 0.17 | 0.52 | 118.07 | 203219.94 |
| aespa | 0.66 | 0.78 | 4.44 | 0.08 | 0.25 | 0.00 | 0.20 | 0.54 | 109.39 | 210446.26 |
| ateez | 0.60 | 0.77 | 4.12 | 0.09 | 0.18 | 0.03 | 0.21 | 0.51 | 125.77 | 195722.94 |
| seventeen | 0.64 | 0.62 | 5.23 | 0.09 | 0.35 | 0.17 | 0.16 | 0.52 | 121.25 | 188441.38 |
| enhypen | 0.59 | 0.77 | 5.76 | 0.08 | 0.07 | 0.04 | 0.23 | 0.55 | 123.92 | 163553.62 |
import pandas as pd

artists = ['bts','straykids','blackpink','twice','txt','nct127','aespa','ateez','seventeen','enhypen']
df_mean = pd.DataFrame(columns=['artist', 'popularity', 'danceability', 'energy', 'key', 'speechiness', 'acousticness',
                               'instrumentalness', 'liveness', 'valence', 'tempo', 'duration_ms',
                               'time_signature'])
for artist in artists:
   df_artist = pd.read_csv('export/clean/{}_spotify_features_clean.csv'.format(artist))
   features_mean = df_artist.mean()
   features_mean.at['artist'] = artist
   df_mean.loc[len(df_mean.index)] = features_mean
df_mean.to_csv('export/artist_kpop_spotify_features_mean.csv')
これらの数値は、各アーティストの楽曲の指標の平均を表しています。BTSの曲は、他のアーティストと比べて一番高いspeechinessを有していることがわかります。またenergyも高い数値であることが確認できます。
他のグループとの比較(指標平均)
2021年度Billboard YEAR-END CHARTS にランクインしたアーティストのデータを使用しています。
| artist | danceability | energy | key | speechiness | acousticness | instrumentalness | liveness | valence | tempo | duration_ms |
|---|---|---|---|---|---|---|---|---|---|---|
| bts | 0.63 | 0.79 | 5.09 | 0.15 | 0.14 | 0.02 | 0.18 | 0.56 | 120.45 | 220039.60 |
| glassanimals | 0.61 | 0.47 | 5.89 | 0.07 | 0.38 | 0.07 | 0.19 | 0.41 | 114.88 | 212440.43 |
| danshay | 0.59 | 0.61 | 5.29 | 0.05 | 0.30 | 0.00 | 0.16 | 0.51 | 120.64 | 199727.20 |
| fleetwoodmac | 0.57 | 0.51 | 5.39 | 0.04 | 0.42 | 0.17 | 0.17 | 0.63 | 122.05 | 238344.39 |
| ajr | 0.57 | 0.61 | 5.23 | 0.08 | 0.19 | 0.00 | 0.18 | 0.50 | 120.86 | 215926.46 |
| thebeatles | 0.53 | 0.52 | 4.65 | 0.06 | 0.41 | 0.06 | 0.23 | 0.59 | 120.62 | 169422.23 |
| floridageorgialine | 0.59 | 0.67 | 5.17 | 0.06 | 0.25 | 0.01 | 0.17 | 0.54 | 124.72 | 204724.16 |
| maroon5 | 0.67 | 0.68 | 5.13 | 0.05 | 0.15 | 0.00 | 0.15 | 0.52 | 118.52 | 219811.42 |
| queen | 0.48 | 0.60 | 5.21 | 0.06 | 0.24 | 0.05 | 0.22 | 0.40 | 110.86 | 262899.93 |
| migos | 0.80 | 0.64 | 4.87 | 0.20 | 0.14 | 0.00 | 0.22 | 0.47 | 133.70 | 233772.86 |
import pandas as pd

artists = ['bts','glassanimals','danshay','fleetwoodmac','ajr','thebeatles','floridageorgialine','maroon5','queen','migos']
df_mean = pd.DataFrame(columns=['artist', 'popularity', 'danceability', 'energy', 'key', 'speechiness', 'acousticness',
                               'instrumentalness', 'liveness', 'valence', 'tempo', 'duration_ms',
                               'time_signature'])
for artist in artists:
   df_artist = pd.read_csv('export/clean/{}_spotify_features_clean.csv'.format(artist))
   features_mean = df_artist.mean()
   features_mean.at['artist'] = artist
   df_mean.loc[len(df_mean.index)] = features_mean
df_mean.to_csv('export/artist_oversea_spotify_features_mean.csv')
上記同様、これらの数値は、各アーティストの楽曲の指標の平均を表しています。BTSの曲は、他のアーティストと比べてspeechinessとenergyがずば抜けて高いことがわかります。
まとめ
今回はSpotify APIからの楽曲データを使用し、BTSの音楽的特質を探っていきました。その結果、いくつか分かったことがあります。
BTSの曲は、
- 他のアーティストと比べて平均して単語(ボーカル)が多い。
- 欧米の人気ポップアーティストに比べて、エネルギッシュ。
- 年々落ち着いた曲になっている傾向がある。
BTSの多くの楽曲は花様年華(かようねんか)、人生で最も美しい瞬間、というテーマで作られている。輝かしい青春の不安や葛藤など、多様な物語が歌詞やエネルギーとして曲に込めているからこそ世界中の多くの人々を魅了しているのではないかと感じました。
今回はBTSを題材にSpotify APIの楽曲データを使用した軽い分析の一例を書かせていただきましたが、手法/切り口はいくらでもあります。機械学習で分類器を作ってみたり、年代別に曲を区切ったり、アルバムごとに比較したりしても面白いかもしれません。高品質で膨大な実データを使って遊ぶことは中々できないため、ぜひ自分の好きなアーティストで試してみてください。世の中ではあまり知られていない隠れた魅力を発見できるかもしれません。
明日はiOSアプリ開発を得意とするえーえすの記事が出るのでぜひチェックしてみてください!!
参考にした記事
A Music Taste Analysis Using Spotify API and Python.
Getting Started with Spotify’s API & Spotipy
The Data Science In BTS’s ‘Map Of The Soul: 7’
The Data Science of K-Pop: Understanding BTS through data and A.I.