[備忘録]ヒートマップの書き方
はじめに
こんにちは。
普段、オミクス解析を使って軟体動物の研究をしている大学院生です。
遺伝子の発現量をヒートマップで表現する機会があったので、ここに学んだ手法をまとめておきます。
今回の目標
- Rで数値データからヒートマッピングを作成する。
- データ入力から出力までの必要な順序を記す。
- 汎用しやすいスクリプトを作成する。→ ""今回のまとめ""#一番下のスクリプト
手順
1. データの入力
・新規データを手入力
・手持ちのデータを読み込む
2. Rで可視化
・heatmap
・ggplot2
はじめに
Rでヒートマップを描けるパッケージはかなり多く知られている。
→ heatmap(), heatmap.2(), heatmaply(), pheatmap()
遺伝子の発現量の単位はTPMやFPKMをratio(logFC)やZ-scoreで示すのが一般的。
→ ここでは任意で設定した仮の数値を扱う。
必要なツール
・R
1. データの入力
・新規データを手入力 (この場でデータを作成する)
データ量が少ない場合は手入力で簡単にできる。
gene_id = c("gene1", "gene2", "gene3", "gene4") #不要
Stomach = c(10, 15, 20, 35)
liver = c(17, 25, 36, 16)
Heart = c(28, 32, 10, 7)
Intestine = c(12, 35, 41, 12)
Rectum = c(17, 12, 13, 12)
data <- data.frame(Stomach, liver, Heart, Intestine, stringsAsFactors = F) #stringsAsFactorsは文字列ベクトルを因子型に変換するかどうか
rownames(data) <- c("gene1", "gene2", "gene3", "gene4")
data <-  as.matrix(data)
data #確認

      Stomach liver Heart Intestine
gene1      10    17    28        12
gene2      15    25    32        35
gene3      20    36    10        41
gene4      35    16     7        12
・手持ちのデータを読み込む (既にあるデータマトリックスを扱う)
データ量が多い時はテキストファイルから読み込む方が簡単。
	Stomach	liver	Heart	Intestine
gene1	10	17	28	12
gene2	15	25	32	35
gene3	20	36	10	41
gene4	35	16	7	12
data <- read.table("data.tsv", row.names = 1, header = TRUE, stringsAsFactors = FALSE)
data <- as.matrix(data)
data #確認
Rで可視化
・heatmap()
heatmap(data) # Default Heatmap
カスタマイズ
scale="column" #column or row。 行列の標準を設定し、クラスタリング
Colv = NA #列の系統樹を削除
Rowv = NA #行の系統樹を削除
xlab="Organ" #x軸ラベル
ylab="Gene ID" #y軸ラベル
main="heatmap" #タイトル
cexRow = 1.5 /cexCol = 1.5 #文字サイズ変更
col = terrain.colors(256) #色の変更 他・・・terrain.color(), rainbow(), heat.colors(), topo.colors(), cm.colors()
カスタマイズの例
heatmap(data, Colv = NA, scale="column", xlab="gene ID", ylab="organ", main="heatmap", cexRow = 1, cexCol = 1)
・ggplot2のgeom_tile()
library(ggplot2)
library(reshape2)
df <- melt(data) #dataをdfに変形
colnames(df) <- c("Num", "Organ", "Value")
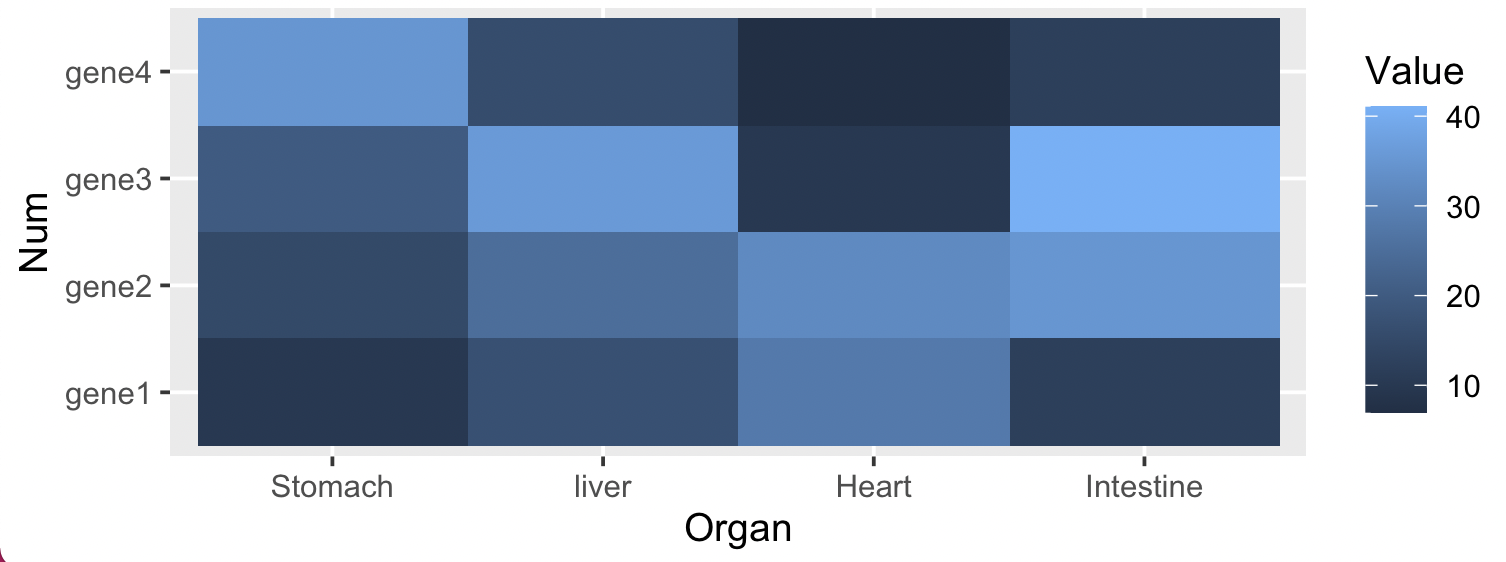
heatmap1 <- ggplot(df, aes(x = Organ, y = Num, fill = Value))+ geom_tile()
heatmap1
カスタマイズ
枠線
theme_bw() #枠線を黒くする
theme_light() #枠線を灰色にする
theme_minimal #枠線を消す
theme_classic() #片側の枠線を消す
背景
theme(panel.background = element_blank()) #背景を消す
グリッド線
theme(panel.grid=element_blank()) #グリッド線を消す
theme(panel.grid.minor = element_blank()) #枠線を消す
theme(panel.grid.major = element_blank()) #枠線を消す
色 (論文っぽい色にする)
1つ目 (RColorBrewerを使ったヒートマップ)
library(RColorBrewer) #パレットはdisplay.brewer.all()で確認できる。
scale_fill_gradientn("value", colours = rev(brewer.pal(9, "YlOrRd")), na.value = "white") #rev()はヒートマップの色の勾配を反転させる。
2つ目 (黄色と赤色に色指定してヒートマップ)
scale_fill_gradientn(colours = c("yellow", "red"))
文字の色、サイズ
theme(axis.text.x = element_text(size = 20, colour = "black")) #x軸の文字の色とサイズを変更
綺麗に見えるカスタマイズ
(heatmap1の続き)
df <- ...
colnames(df) <- ...
↓↓↓↓↓↓↓↓↓↓↓
library(RColorBrewer)
heatmap2 <- ggplot(df, aes(x = Organ, y = Num, fill = Value))
            + geom_tile()
            + theme_minimal()+theme(panel.grid=element_blank())
            + theme(axis.text.x = element_text(colour = "black"))
            + theme(axis.text.y = element_text(colour = "black"))
            + scale_fill_gradientn("Value", colours = brewer.pal(9, "YlOrRd"), na.value = "white")
heatmap2
↑↑↑↑↑↑↑↑↑↑↑
感想
heatmapはクラスタリングすると結果の解釈に役立つ。
ggplot2のヒートマップは他のグラフにも変換しやすい。
今回のまとめ
#データの読み込み
data <- read.table("data.tsv", row.names = 1, header = TRUE, stringsAsFactors = FALSE)
data <- as.matrix(data)
ggplot #確認

#ggplot
library(ggplot2)
library(reshape2)
library(RColorBrewer)
df <- melt(data)
colnames(df) <- c("Num", "Organ", "Value")
heatmap2 <- ggplot(df, aes(x = Organ, y = Num, fill = Value))
            + geom_tile()
            + theme_minimal()+theme(panel.grid=element_blank())
            + theme(axis.text.x = element_text(colour = "black"))
            + theme(axis.text.y = element_text(colour = "black"))
            + scale_fill_gradientn("Value", colours = brewer.pal(9, "YlOrRd"), na.value = "white")
heatmap2
引用
→heatmapとggplot2の例
https://www.r-graph-gallery.com/heatmap#:~:text=A%20heatmap%20is%20a%20graphical,is%20natively%20provided%20in%20R.
→ggplot2
https://ggplot2.tidyverse.org/index.html
→ggplot2 (クラスタリングの例)
https://stats.biopapyrus.jp/r/ggplot/geom-tile.html


