Appiumでのテストで機械学習を使ってみた(GradCAM)
はじめに
前々回で自動テストにCNNを使ったが、私が従事しているトラディショナルな組み込み現場ではあまり受けは良くない。業務に利用するには何らかのエビデンスを示す必要がでてくる(他ではこんな事問題にならない?)。
今回、TensorFlowでCNNを利用したのだからtf-keras-visでGradCAMを利用すれば上への業務報告や、改善に役に立つのではないかとうことで前々回の題材でGradCAM(Gradient-weighted Class Activation Mapping)を利用してみた。
準備
-
環境
Windows 10
Python 3.7
tensorflow 2.3.0
tf-keras-vis 0.5.5 -
tf-keras-vis インストール
本家 tf-keras-vis。
$ pip install tf-keras-vis tensorflow
GradCAMを取得してみる
題材は前々回と同じワードパット。
ワードパット上に何か記述して3パターンに分けて学習させます。
前々回の記事では '1','2','None'の3カテゴリー としましたが、今回はカテゴリー名は'1'(0), 'None'(1), 'o'(2) とし、カテゴリー**’o’**の画像のGradCamを取得して見ます。
loss関数、model_modifierについてはこちらも本家のexampleを読んでください。
CategoryOGradAM.py
# -*- coding: utf-8 -*-
import numpy as np
import matplotlib.pyplot as plt
from matplotlib import cm
import tensorflow as tf
from tf_keras_vis.gradcam import Gradcam
from tf_keras_vis.utils import normalize

# loss functionの設定
def loss(output):
    #[イメージIndex][カテゴリーIndex]
    return (output[0][2])

# Define modifier to replace a softmax function of the last layer to a linear function.
def model_modifier(m):
   m.layers[-1].activation = tf.keras.activations.linear
   return m

if __name__ == '__main__':
    #モデルの読み込み.
    model =  tf.keras.models.load_model('Category_simple.h5')
    #カテゴリー o のイメージの読み込み.
    ImageFile = "add_View_0_0.png"
    Image = tf.keras.preprocessing.image.load_img(ImageFile,target_size=(150,150))

   #読み込み画像の表示.
    fig = plt.figure()
    ax1 = fig.add_subplot(1, 2, 1)
    ax1.imshow(Image)
    plt.imshow(Image)
    #Image change to arry.
    input_arr = tf.keras.preprocessing.image.img_to_array(Image)
    input_arr = np.array([input_arr])

   #確認のため分類結果を表示.
    predictions = model.predict(input_arr)
    print("Category : Label{'1': 0, 'None': 1, 'o': 2}")
    print(predictions) #Output >> [[0. 0. 1.]]

    # Create Gradcam object
    gradcam = Gradcam(model, model_modifier, clone=False)

    # GradCAMの結果からヒートマップを作成.
    cam = gradcam(loss, input_arr)
    cam = normalize(cam)
    ax2 = fig.add_subplot(1, 2, 2)
    for i in range(len(cam)):
        heatmap = np.uint8(cm.jet(cam[i])[..., :3] * 255)
        ax2.imshow(Image)
        ax2.imshow(heatmap, cmap='jet', alpha=0.5)
    #結果表示.
    fig.show()
結果
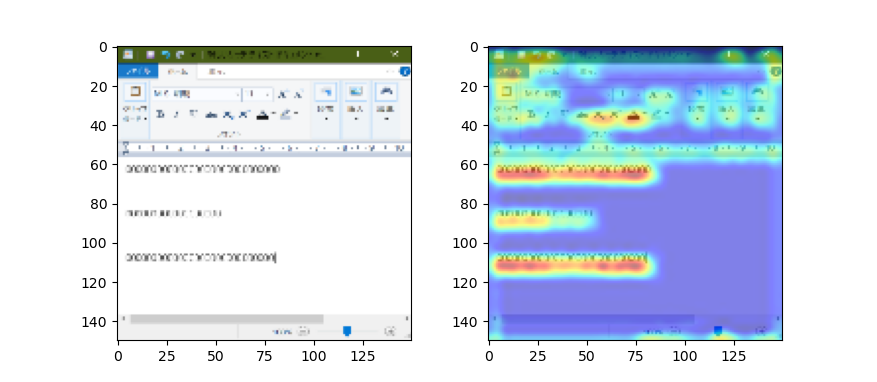
これでテストランナーのCNNが何をしているか説明できればいろいろ(上への言い訳)役立つのではないでしょうか。
最初はいつもお世話になっているQiitaへの何かしらのお返しのつもりで書き始めましたが、5回になってしまいました。
テストサンプルをバラバラと載せた記事になってしまいましたが日常業務のヒントになれば幸いです。