ある晩、旧知の研究者からggplot2を使って下記のようなグラフを書きたい、と問い合わせがありました。
- ggplot2で回帰曲線を描きたい
- グラフのある点で回帰式が変わるので (次数が上がるとか言ってた)、区間ごとに分けて書きたい
- geom_smoothではなくて、推定されたパラメータを使ってダイレクトに書きたい
- predict関数を使うとグラフがギザギザになるので、別の方法で
ちょうど私も中断時系列/回帰分断モデルのggplot2での作図に苦労していたので、二つ返事で引き受けました。
少し時間がかかってしまいましたが、宿題を提出致します。
結論
- layer関数の第一引数にpredictで推定したデータのsubsetを指定することで、「ある時点」前後のグラフを重ねて出力することができる。
- predict関数を用いても、ギザギザしないグラフを書くことはできる。ただし、パラメータの設定次第。
- βとInterceptから回帰曲線を引く方法は突き止められませんでした。
参考資料 (このポストよりも参考にすべき!)
ITSについてはBernalらが簡潔で分かりやすいtutorialを書いてくれています。Rのコードも公開してくれていますが、plotはデフォルトの描画関数を使っておりまして、ggplot2での実例はありません。
https://academic.oup.com/ije/article/46/1/348/2622842
ggplot2でのITSについては、kaz_yosさんが英語で簡単にまとめてくださっています。Layer + subsetを使う、という今回のアイデアはこのポストを参照しました。
https://rpubs.com/kaz_yos/its1
Bernalらのtutorialを基にしたITSの日本語での解説としては、宜保さんがREQUIRE31での発表資料をSlideshareに公開してくださっています。なお、私もREQUIRE31で話題提供していますが、資料はまだ上げていません。
https://www.slideshare.net/koichirogibo/its-81063341
今日の目標
- Bernalらの解析を、ggplot2で再現する。
解説論文やデータは上記Bernalらの論文とそのサプリメントから適宜入手してください。
harmonic関数で周期性を調整しない場合
# ソースコード
### Loading Packages
library(lmtest)
library(Epi)
library(tsModel)
library(vcd)
library(foreign)
library(splines)
library(tidyverse)
library(readxl)
library(ggplot2)

### loading data
data <- read_csv("sicily.csv")

## model02
# Poisson including interaction with the standardised population as an offset
model02 <- glm(aces ~ offset(log(stdpop)) + smokban + time + smokban:time, family = poisson, data)
summary(model02)
round(ci.lin(model02, Exp=T), 3)

acf(resid(model02))

# predicting with model02
data.pred <- data.frame(time, smokban)
data.pred$rate <- predict(model02, type="response", newdata = data.pred)/data$stdpop*10^5

# plotting ITS results with "line" graph, using model02
graph02.01 <- ggplot(data = data, mapping = aes(x=time, y=rate)) +
  layer(geom = "point", stat = "identity", position = "identity") +
  layer(data = subset(data.pred, time <= 36), geom = "line", stat = "identity", position = "identity", params = list(colour = "red", size=1.5), show.legend=FALSE) +
  layer(data = subset(data.pred, time > 36), geom = "line", stat = "identity", position = "identity", params = list(colour = "blue", size=1.5), show.legend=FALSE)
plot(graph02.01)
ggsave(filename = "graph02_01.jpg", graph02.01, width = 24, height = 15, units = "cm", dpi = 300)
というわけで完成図とコードはこちら。
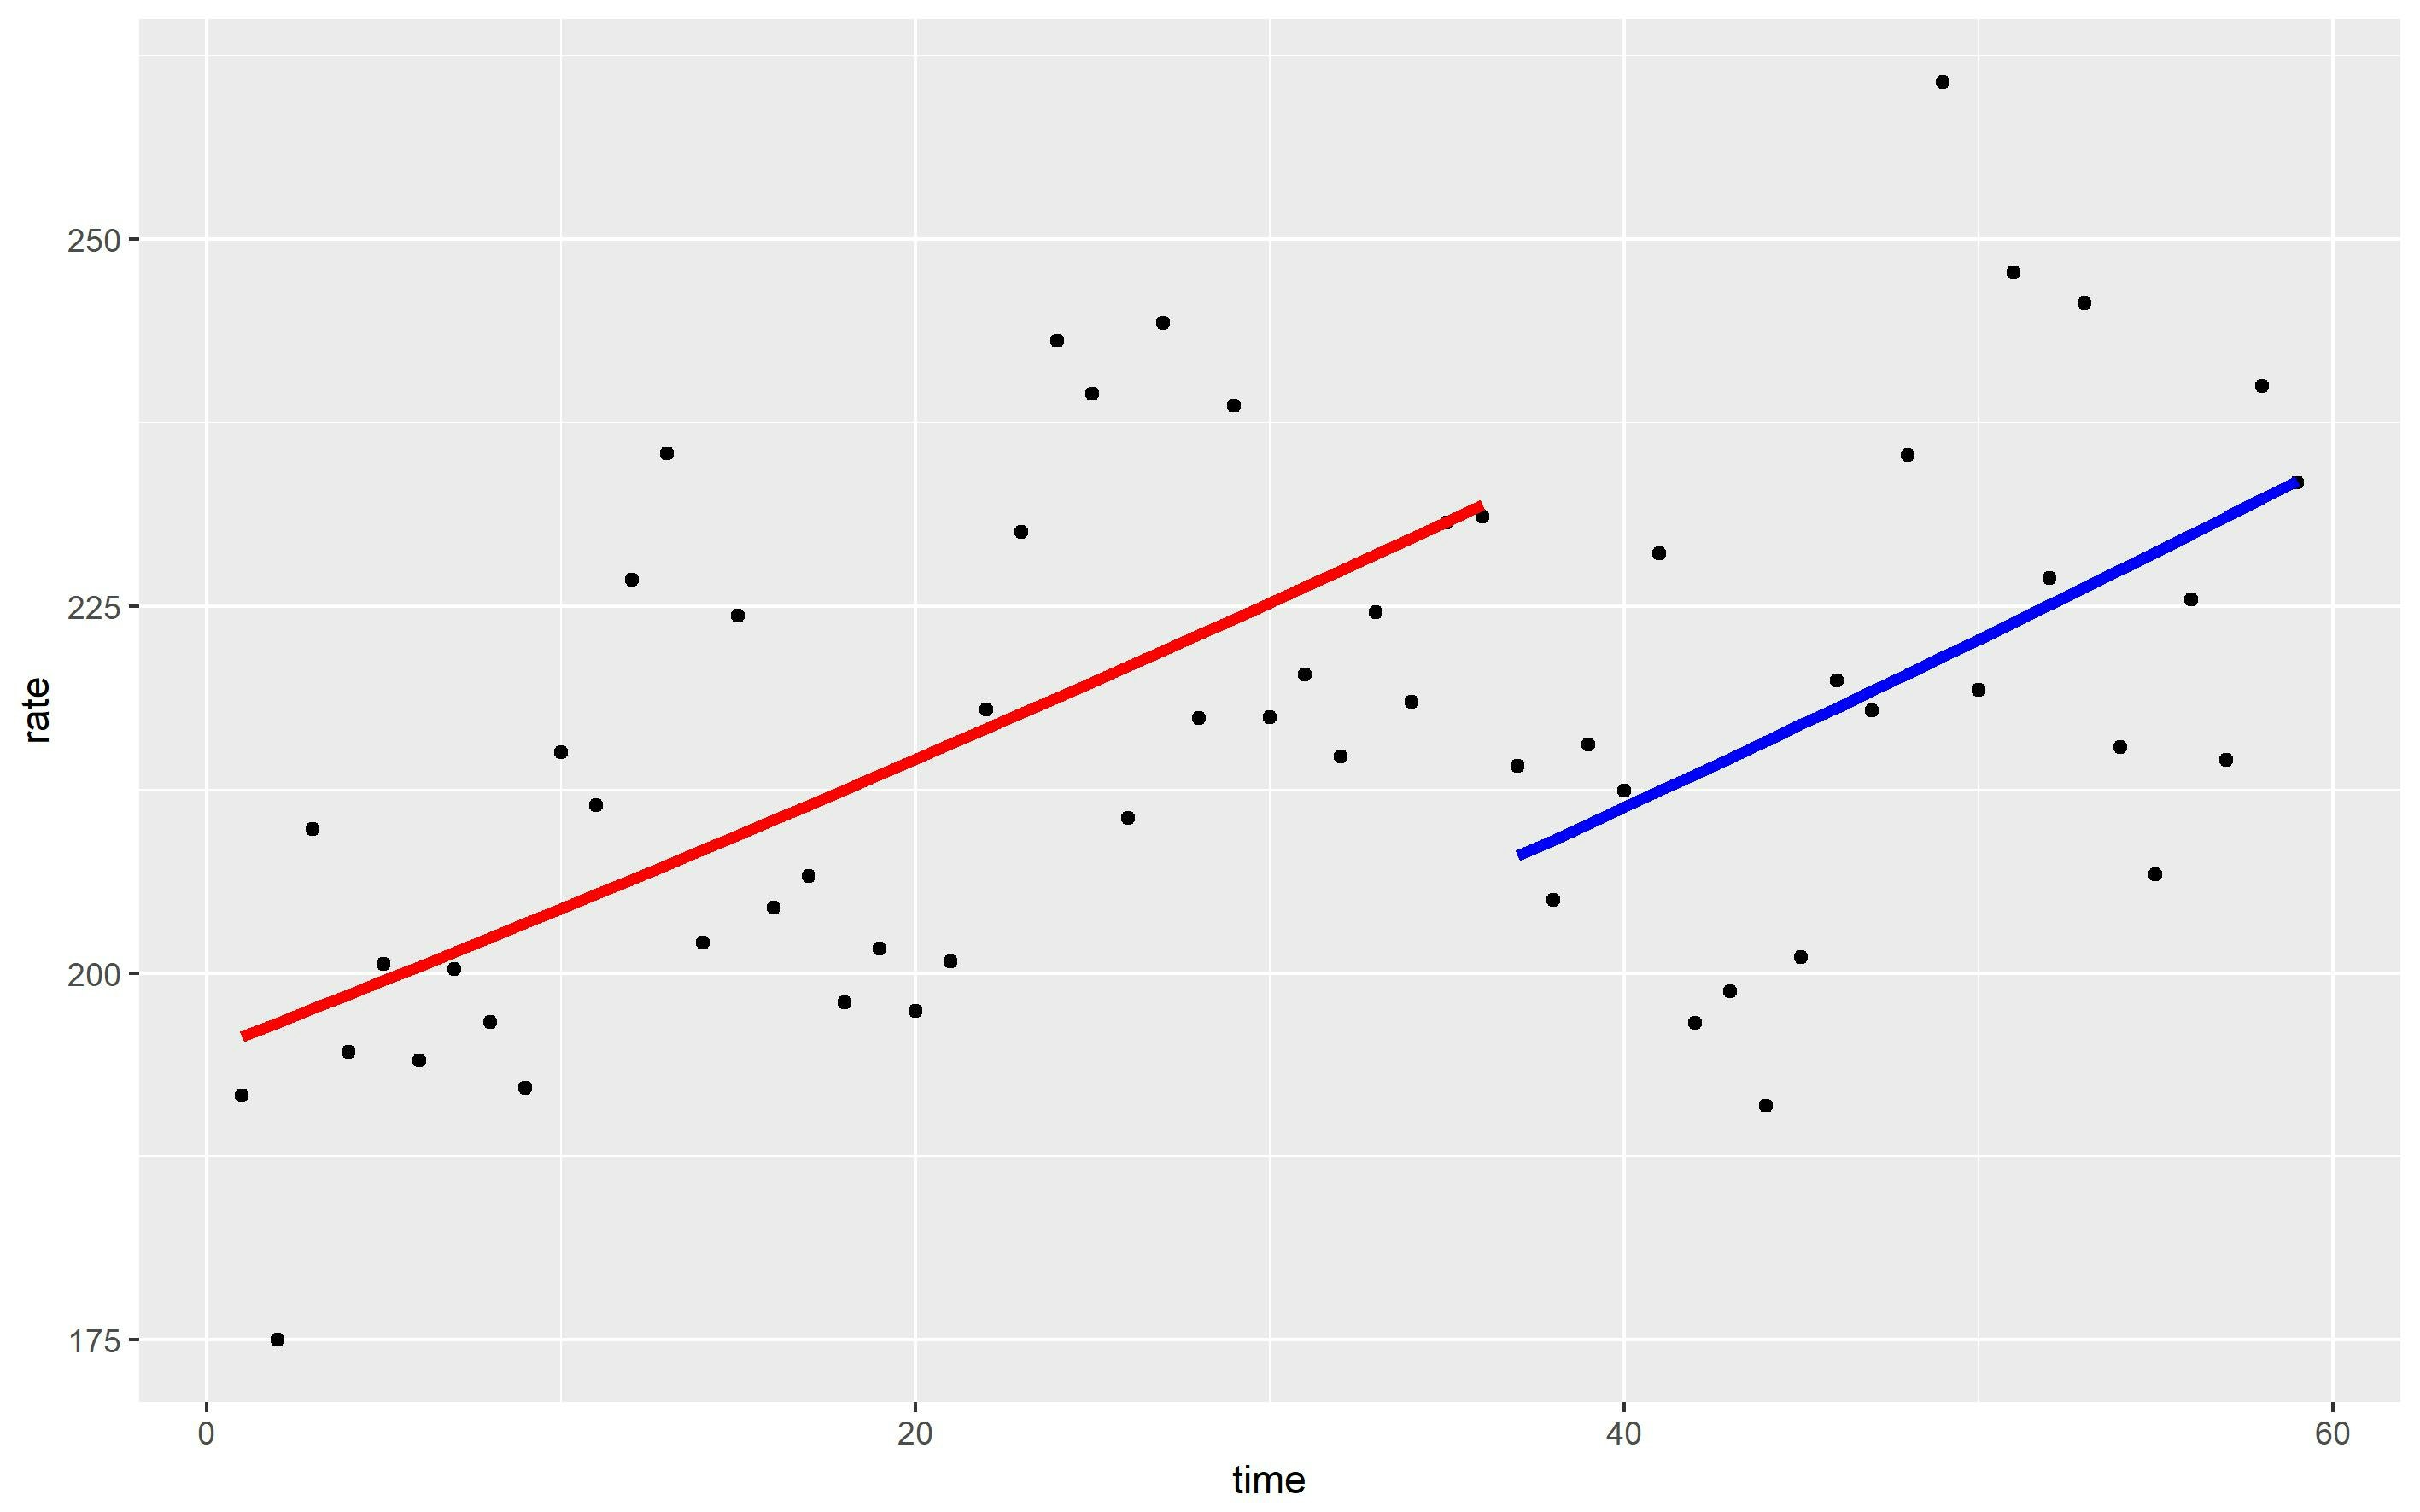
layer関数を使って異なるグラフを重ねていくのがコツです。今回の出力では、「10万人対比のイベント数のプロット」「禁煙前の推定結果」「禁煙後の推定結果」の3枚のlayerを重ねています。
predict関数では、ITSでの推定結果を利用しています。こちらのデータでは周期性を考慮していないので、ほぼ直線状の推定結果を得ることができました。時間の影響だけをシンプルに見せたい場合はこれでも良いですが、自己相関には注意が必要で、当然ながら推定結果の妥当性は検証が必要です。
Bernalらのソースコードでは、推定結果をmean(data$stdpop) で除していますが、その場合は推定値のグラフがギザギザになります。アウトカムを発生数とし、人口当たりに均すために標準化人口をオフセット項に投入しています。標準化人口は毎月のデータがあるため、月間の変動がノイズとして乗ることになります。
ggplot2が更新されたためか、kaz_yosさんの記法ではlayerでエラーが発生します。詳細は調べられていませんが、大元のggplotからデータを継承しない場合、statとpositionを明示的に指定する必要があるようです。また、colour/sizeといった描画用の変数はparam = list() 内に格納してやる必要があります (2018/03/05現在)。
harmonic関数で周期性を調整した場合
## model03
# Poisson including interaction with the standardised population as an offset, with harmonic
model03 <- glm(aces ~ offset(log(stdpop)) + smokban + time + smokban:time + harmonic(month, 1, 12), family = poisson, data)
summary(model03)
round(ci.lin(model03, Exp=T), 3)

acf(resid(model03))

# predicting with model02
data.pred <- data.frame(time, smokban)
data.pred$rate <- predict(model03, type="response", newdata = data.pred)/data$stdpop*10^5

# plotting ITS results with "line" graph, using model02
graph03.01 <- ggplot(data = data, mapping = aes(x=time, y=rate)) +
  layer(geom = "point", stat = "identity", position = "identity") +
  layer(data = subset(data.pred, time <= 36), geom = "line", stat = "identity", position = "identity", params = list(colour = "red", size=1.5), show.legend=FALSE) +
  layer(data = subset(data.pred, time > 36), geom = "line", stat = "identity", position = "identity", params = list(colour = "blue", size=1.5), show.legend=FALSE)
plot(graph03.01)
ggsave(filename = "graph03_01.jpg", graph03.01, width = 24, height = 15, units = "cm", dpi = 300)
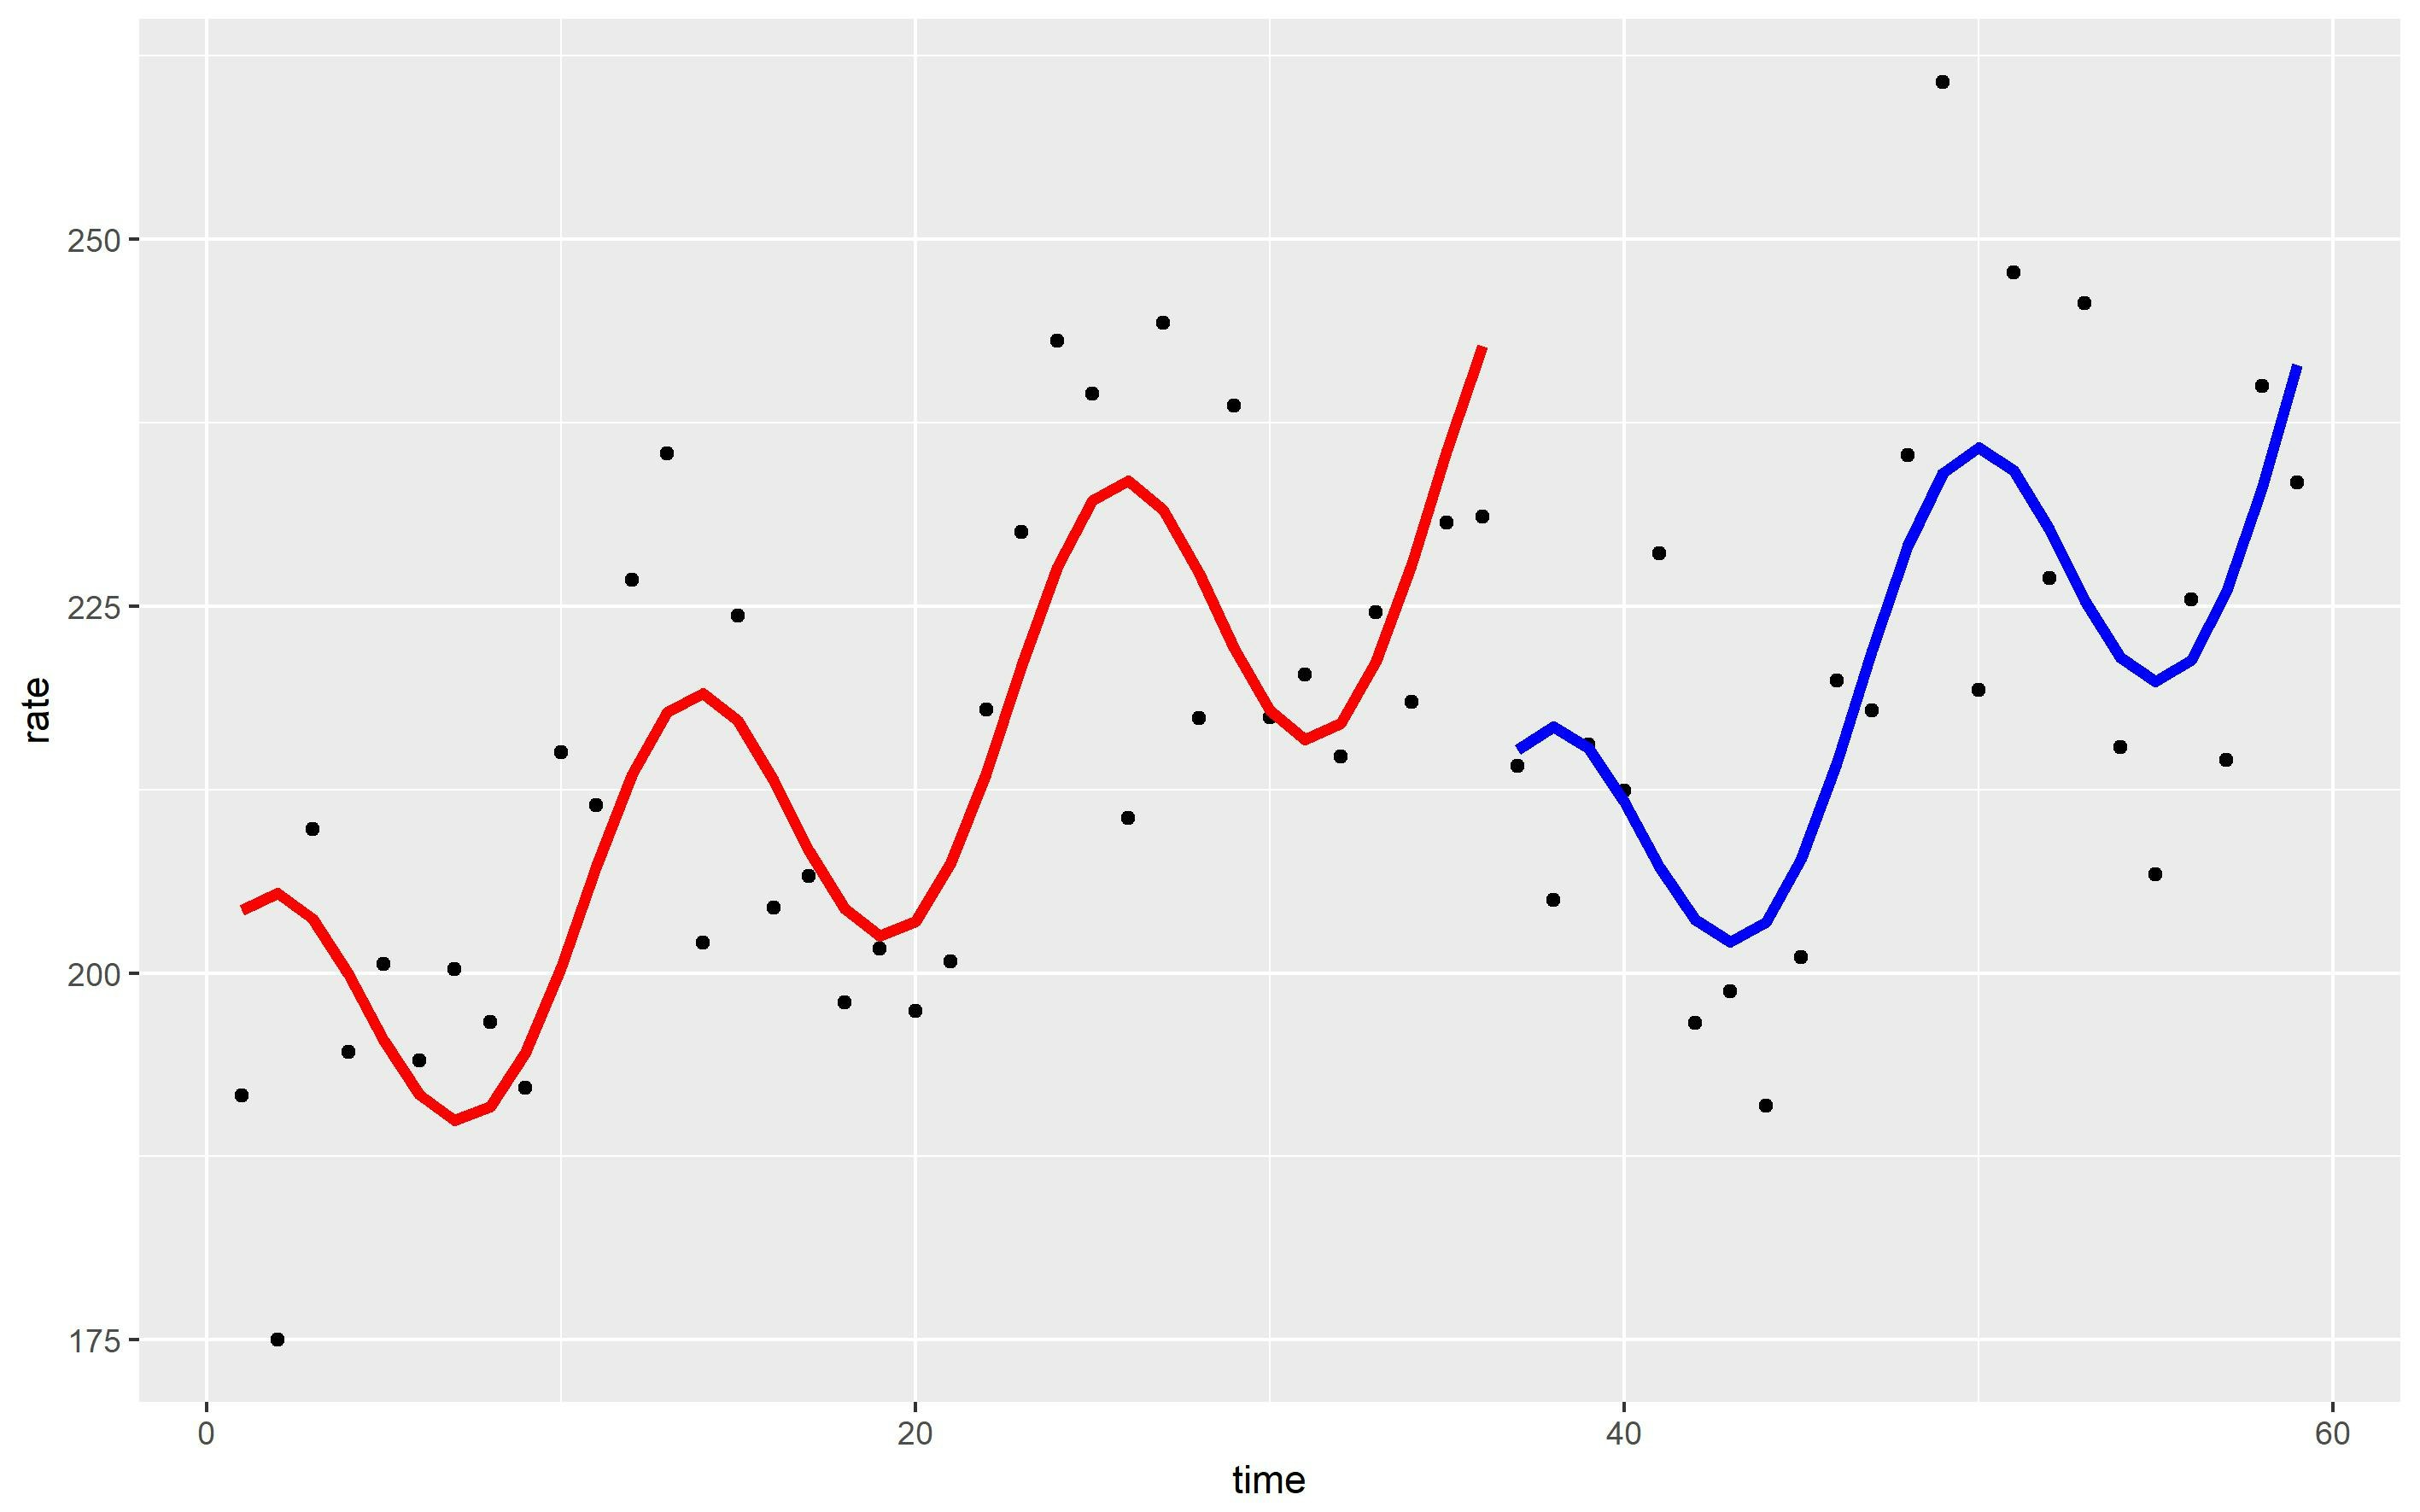
こちらはharmonic関数で周期性 (季節性) を補正したものです。グラフは綺麗なサインカーブを描いていますね。
ITSでは時系列データを扱うため、自己相関を考慮する必要があります。その方法のひとつがフーリエ級数を利用する方法で、Rではharmonic関数を使用します。
harmonic(x, nfreq, period, intercept = FALSE)

x: 季節を表す変数
nfreq: 1期あたりに含まれる周期の数
period: 1期あたりのデータ点数
Bernalらのデータでは、月当たり (period = 12)、1期当たり周期は2 (nfreq = 2) と設定しています。harmonic項を投入する前のAICは709.91、harmonic(month, 2, 12) を投入した後は636.54、参考までにharmonic(month, 1, 12) を投入した場合は645.36でした。 目視ではnfreqは判別しにくいので、手動でいくつか回して、AICやBICで適合度を確認すると良いでしょう。
頂いた宿題への回答
単一のモデルで表現できているなら、このポストと同じようにpredict -> layer + subsetで行けると思います。
できないのであれば、モデルが変わる前後でpredict関数で予測して、rbindで縦結合してやると、このポストと同じ方法が取れると思います。
……と思ったけど、rbind結合では再現できなさそうです。結果が一つのリストに入ってない場合、この方法での作図は厳しそうです。

