はじめに
Life is Tech !でメンターをしているコバトンです。今回はweb系でgooglemapを用いて可視化をするというテーマについてやっていきたいと思います!
みなさんが何気なくアプリなどで使っているgooglemap実はめちゃくちゃ便利で、とてもカスタマイズもしやすいものとなっているので、みなさんのオリジナルアプリにも使ってみると良いのかなと思っています!
そこで、今回はgooglemap apiを使います!
今回はopen weather map apiを用いて気温を可視化していきたいなと思っていたのですが、json周りのアクセス環境周りで難しくなってしまいそうだったので、googlemapのドキュメントから取ってきたデータを可視化していきましょう!
それでは初めていきましょう!
今回使うgooglemaps apiはjavascriptで書くことができます!javascriptを用いてmapライフを楽しんでいきましょう!
googlemapで描画する
まず, フォルダをつくり,index.htmlに描画する
<!DOCTYPE html>
<html lang="ja">
<head>
  <meta charset="UTF-8">
  <meta name="viewport" content="width=device-width, initial-scale=1.0">
  <meta http-equiv="X-UA-Compatible" content="ie=edge">
  <title>Document</title>
</head>
<body>

</body>
</html>
このいつもの 雛形ができたら、googlemapを描画するための準備をしていきます!
今回はgooglemapを描画するためのスペースを今回はid = "map"
としていきたいと思っています。
<div id = "map"></div>
次にgooglemaps apiに登録してapikeyを取得して一番したで読み込んでいきましょう!
<script async defer src="https://maps.googleapis.com/maps/api/js?key=自分で作成したAPIKEY=initMap">
次に、googlemaps.jsというファイルを作り、googlemaps.jsの中に書いていきましょう!
    var map;

    function initMap() {
      map = new google.maps.Map(document.getElementById('map'), {
        zoom: 3,
        center: {
          lat: 38.865427,
          lng: 140.196123
        },
        mapTypeId: 'terrain'
      });
    }
googlemaps.jsについて解説していきます!
今回指定しているのは、中央の座標(緯度経度)をする。
どこに指定しているのかというのを決めています!
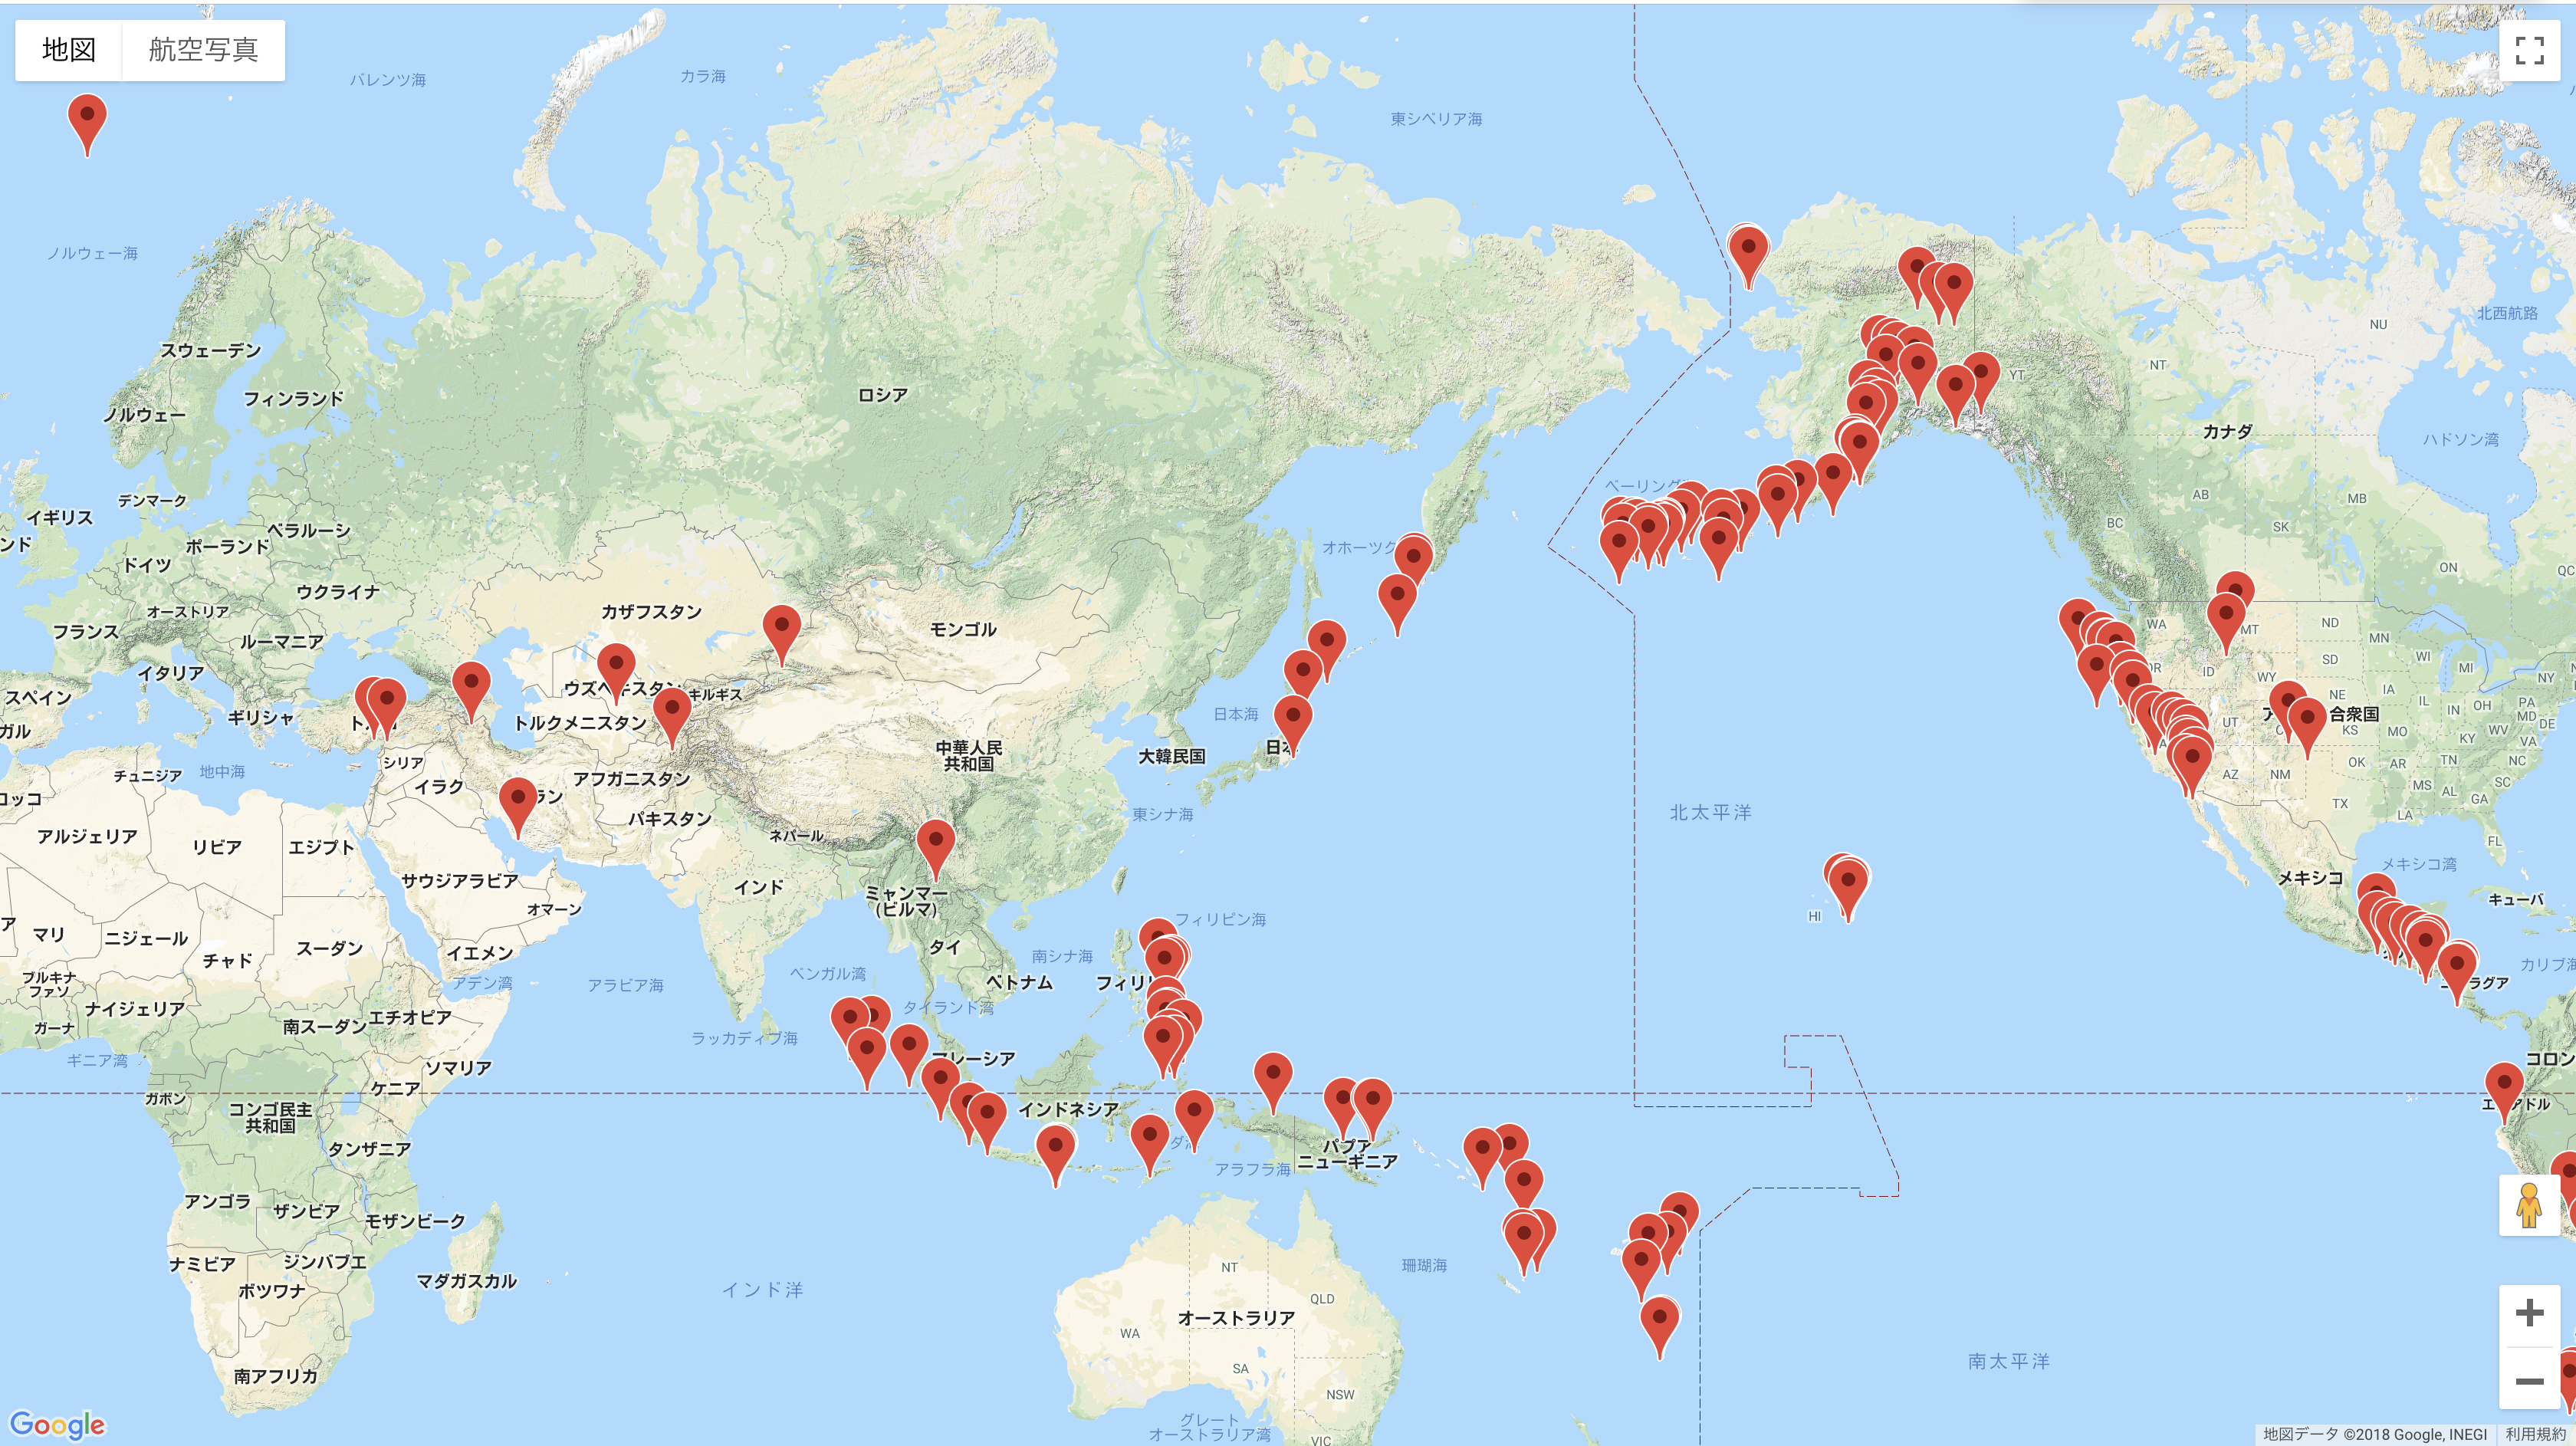
googlemapにいつものポインタを表示する
    script.src = 'https://developers.google.com/maps/documentation/javascript/examples/json/earthquake_GeoJSONP.js';
    document.getElementsByTagName('head')[0].appendChild(script);
データを読み込んで、あるデータの緯度経度にいつものポインタを出力します!
このデータ自体は上の方でcoordinateという部分に緯度経度が記入してあります!

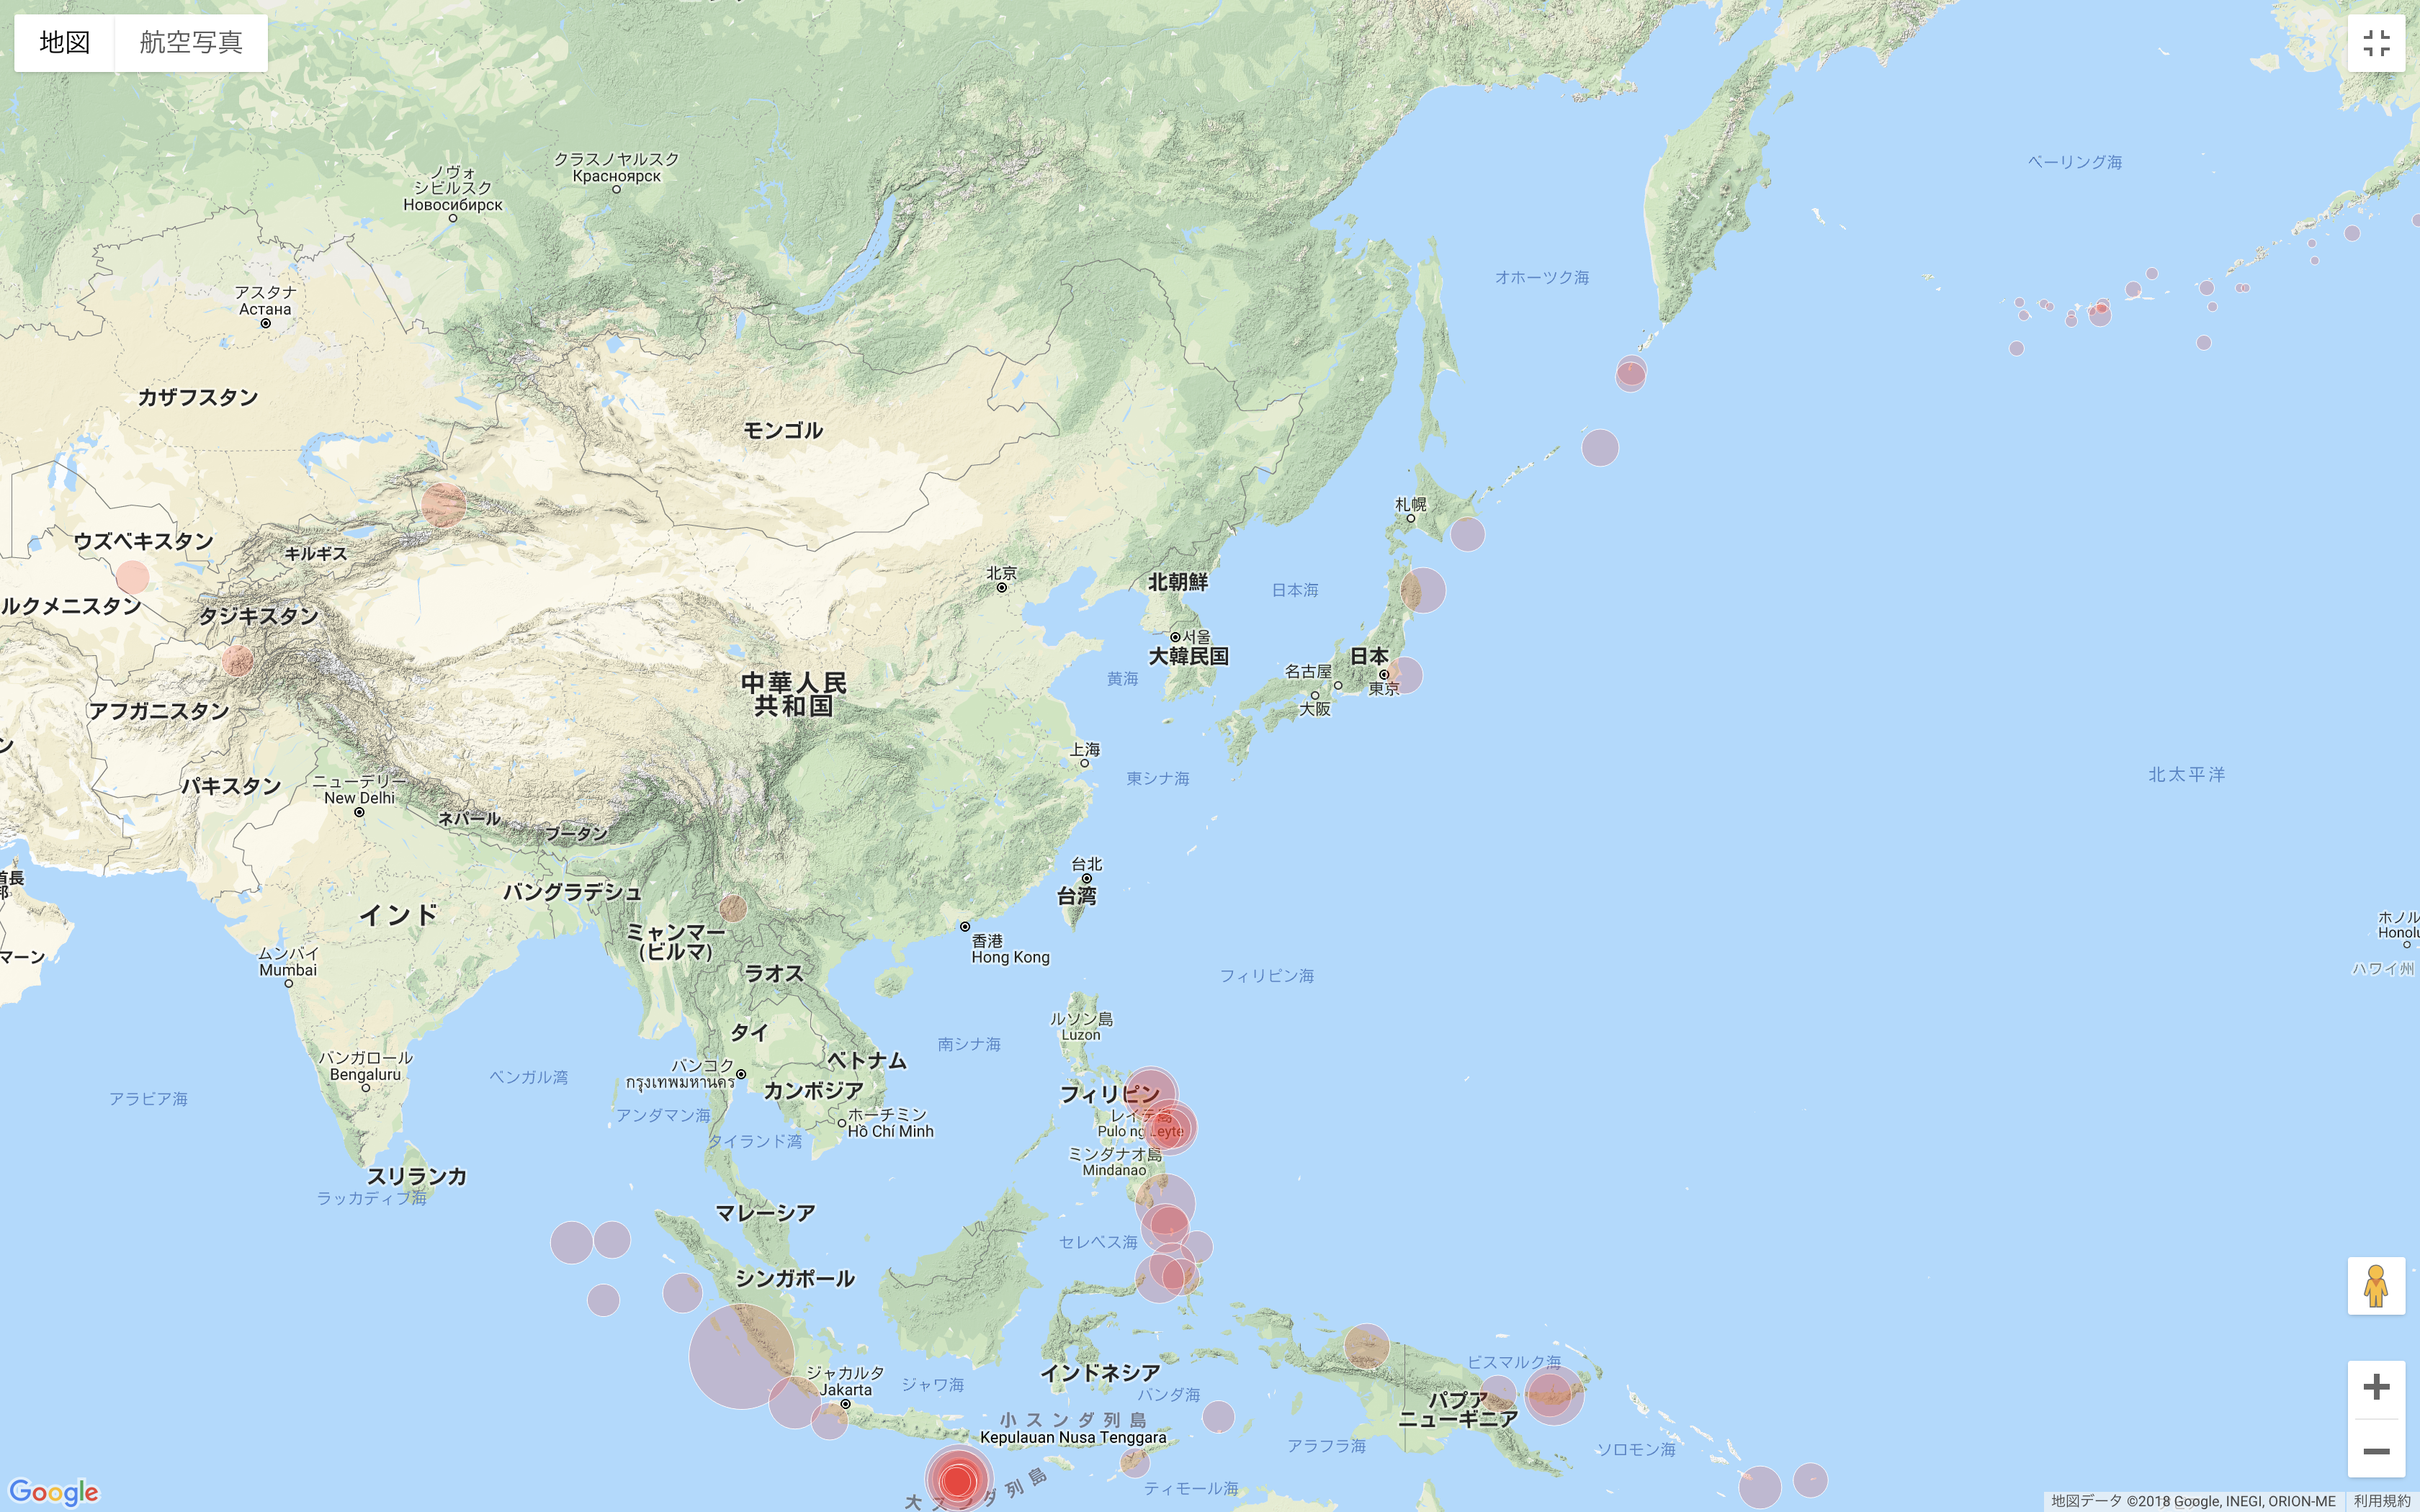
いつものポインタをサークルに変更する
   map.data.setStyle(function (feature) {
      var magnitude = feature.getProperty('mag');
      return {
        icon: getCircle(magnitude)
      };
    });

    function getCircle(magnitude) {
      return {
        path: google.maps.SymbolPath.CIRCLE,
        fillColor: 'red',
        fillOpacity: .2,
        scale: Math.pow(2, magnitude) / 2,
        strokeColor: 'white',
        strokeWeight: .5
      };
    }
このコードはアイコンの設定を変えています!
また、magnitudeをの値によって、大きさが変わるように指数関数をを用いて定義しています!
最後に
googlemapsを用いると様々なカスタマイズもできたりして、ドキュメントもとても充実しています!英語ですがみなさんも読んでみましょう!
p.s. 明日はMincraft&Androidメンターでバリバリコードのかけるほりーです!整数電卓コンパイラを作ってくれるそうです楽しみですね!
これからの記事も楽しんでいきましょう!
