概要
データ分析で観光地の分布を地図上に描画したいような状況を想定する。分析するには緯度経度が必要だが、住所しかない。そのため住所から緯度経度を求めないといけない。Google Maps Platformは有料サービスである。OSSの「geopy」は詳細な住所から緯度経度に変換できない、おおよその住所であればその緯度経度が分かる。
→ex)「東京都墨田区押上」は成功するが、「東京都墨田区押上1丁目」は失敗する
国土地理院APIを用いれば住所から緯度経度に変換でき、OSSで結果も信頼できるだろうということで採用した。
処理フロー
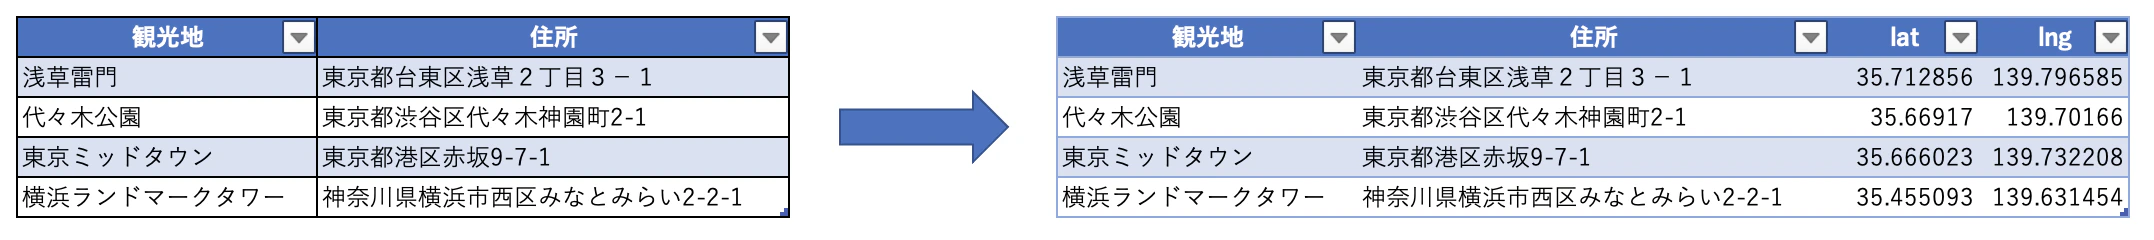
住所が記載されたcsvより国土地理院APIを用いて緯度経度を求めて、元のcsvに緯度経度を追加する。
先ほどの緯度経度よりfoliumで描画する。

実装
import pandas as pd
import requests
import urllib
import folium
# 国土地理院API
GeospatialUrl = "https://msearch.gsi.go.jp/address-search/AddressSearch?q="
# データフレーム作成
df = pd.read_csv('./sample_address.csv')
# 国土地理院APIより住所→緯度経度に変換
lat_list = []
lng_list = []
for index, row in df.iterrows():
    s_quote = urllib.parse.quote(row.住所)
    response = requests.get(GeospatialUrl + s_quote)
    try:
        lat_list.append(response.json()[0]["geometry"]["coordinates"][1])
        lng_list.append(response.json()[0]["geometry"]["coordinates"][0])
    except Exception as e:
        print(e)
# inputデータに緯度経度を追加する
df_new = df.copy()
try:
    df_new['lat'] = lat_list
    df_new['lng'] = lng_list
except Exception as e:
    print(e)

# csvに結果を保存する
df_new.to_csv('./result_add2latlng.csv', encoding='shift-jis', index=False)
# 観光地をmapに描画する
m = folium.Map(location=[df_new[0:1].lat, df_new[0:1].lng], tiles='OpenStreetMap', zoom_start=10)
for i, marker in df_new.iterrows():
    name='Location:'+str(i)
    lat = marker.lat
    lon = marker.lng
    popup ="<strong>{0}</strong><br>Lat:{1:.3f}<br>Long:{2:.3f}".format(name, lat, lon)
    folium.Marker(location=[lat, lon], popup=popup, icon=folium.Icon(color='lightgreen')).add_to(m)

# HTML出力
m.save('./mapping' + '.html')
まとめ
住所が記載されたcsvから、国土地理院APIを用いて緯度経度に変換することができた。国土地理院APIはOSSで使いやすい。