はじめに
前回の記事
【Python】初めての データ分析・機械学習(Kaggle)
【Python】初めての データ分析・機械学習(Kaggle)〜Part2〜
に引き続き、Kaggleで比較的優しいコンペ「House Prices: Advanced Regression Techniques」に挑戦しました!
今回のコンペは、住宅に関する情報の変数をもとに、住宅の価格を推定するというもの。
しかし、この住宅に関する変数が80もあり、いきなり怖気付きました、、(笑)
「こんなのできるのか、、?」て思いつつ、今回もしっかり先人の知恵を借りました!笑
参考コード↓↓↓
大まかな流れは、以下のようになっています。
- 特徴エンジニアリング
- Imputing missing values 欠損値の穴埋め
- Transforming データ変換(log変換等)
- Label Encoding カテゴリカルデータのエンコード
- Box Cox Transformation : 正規分布に近づけさせるための変換
- Getting dummy variables カテゴリカルデータを数値データへ
- モデリング(スタッキングアンサンブル学習)
- ベースモデル解析
- 第2モデル解析
そして、本記事では、 特徴エンジニアリング に焦点を当てていきます!
データ取得・ライブラリインポート
# ライブラリのimport

import numpy as np # 線形代数
import pandas as pd # データ処理、csvファイルの操作
%matplotlib inline
import matplotlib.pyplot as plt  # Matlab-style plotting
import seaborn as sns
color = sns.color_palette()
sns.set_style('darkgrid')
import warnings
def ignore_warn(*args, **kwargs):
    pass
warnings.warn = ignore_warn #不要な警告の無視(from sklearn and seaborn)


from scipy import stats
from scipy.stats import norm, skew #統計操作

pd.set_option('display.float_format', lambda x: '{:.3f}'.format(x)) #小数点の設定

from subprocess import check_output
print(check_output(["ls", "../input"]).decode("utf8")) #ファイルが有効かチェック
data_description.txt
sample_submission.csv
test.csv
train.csv
データフレーム作成
# データの取得、データフレームの作成
train = pd.read_csv('../input/train.csv')
test = pd.read_csv('../input/test.csv')
データフレームを見てみよう!
## データフレームの表示
train.head(5)

# サンプル数と特徴数
print("The train data size before dropping Id feature is : {} ".format(train.shape))
print("The test data size before dropping Id feature is : {} ".format(test.shape))

# 'Id'カラムの保存
train_ID = train['Id']
test_ID = test['Id']

# 予測のプロセスではIDは不必要なので削除
train.drop("Id", axis = 1, inplace = True)
test.drop("Id", axis = 1, inplace = True)

# IDが消えているかもう一度確認
print("\nThe train data size after dropping Id feature is : {} ".format(train.shape))
print("The test data size after dropping Id feature is : {} ".format(test.shape))
The train data size before dropping Id feature is : (1460, 81)
The test data size before dropping Id feature is : (1459, 80)

The train data size after dropping Id feature is : (1460, 80)
The test data size after dropping Id feature is : (1459, 79)
学習用データが1460個,特徴が80個
テスト用データが1459個,特徴が79個になりました!
え、特徴多すぎ!!
こんなんどうやって分析すればいいんか、、
とりあえず、データの欠損値、歪度、カテゴリカルデータの数値化をやっていきましょう!
データ前処理
まずは、欠損値から見ていきます!
基本的にデータの欠損率が15%以上の特徴は消していいとのこと!!
1. 欠損値
学習用データのtrainとテスト用データのtestでまとめて欠損値を処理するために一度、データを統合します!
ntrain = train.shape[0]
ntest = test.shape[0]
y_train = train.SalePrice.values
all_data = pd.concat((train, test)).reset_index(drop=True)
all_data.drop(['SalePrice'], axis=1, inplace=True)
print("all_data size is : {}".format(all_data.shape))
all_data size is : (2917, 79)
データ数が2917、特徴数が79なのでいい感じに統合できました!
欠損値を持つ特徴を効率よく洗い出すために、
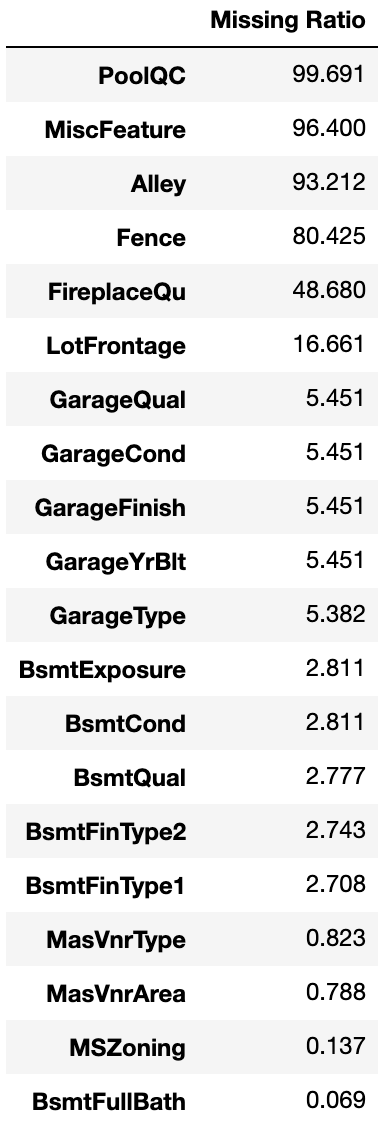
1. 全特徴の欠損率を算出して、欠損値率>0の特徴を新しいデータフレームに入れる
2. 欠損率を可視化
3. 特徴ごとに、削除or値の代入の検討をする
この流れで欠損値の処理をしていきます!
1. 全特徴の欠損率を算出して、欠損値率>0の特徴を新しいデータフレームに入れる
all_data_na = (all_data.isnull().sum() / len(all_data)) * 100
all_data_na = all_data_na.drop(all_data_na[all_data_na == 0].index).sort_values(ascending=False)[:30]#欠損値が含まれる変数のみ抽出
missing_data = pd.DataFrame({'Missing Ratio' :all_data_na})#データフレームに入れる。
missing_data.head(20)
2. 欠損率を可視化
f, ax = plt.subplots(figsize=(15, 12))
plt.xticks(rotation='90')
sns.barplot(x=all_data_na.index, y=all_data_na)
plt.xlabel('Features', fontsize=15)
plt.ylabel('Percent of missing values', fontsize=15)
plt.title('Percent missing data by feature', fontsize=15)

3. 特徴ごとに、削除or値の代入の検討をする
上のグラフに上がった欠損値を含む特徴に値を入れていきます!
特徴1つ1つ検討しながらなので、少し大変ですがやっていきます!
- PoolQC : ほとんどが欠損値。欠損値には「プールが無い」という意味でNoneを入れる
all_data["PoolQC"] = all_data["PoolQC"].fillna("None")
- MiscFeature : データの説明によると、NAは「その他機能がない」という意味。欠損値にはNoneを入れます
all_data["MiscFeature"] = all_data["MiscFeature"].fillna("None")
- Alley : データ説明によると、「路地へのアクセスなし」という意味。欠損値にはNoneを入れます
all_data["Alley"] = all_data["Alley"].fillna("None")
- Fence : 「フェンスがない」という意味。欠損値にはNoneを入れます
all_data["Fence"] = all_data["Fence"].fillna("None")
- FireplaceQu : 「暖炉がない」という意味。欠損値にはNoneを入れます
all_data["FireplaceQu"] = all_data["FireplaceQu"].fillna("None")
-
LotFrontage : 近所の家の平均値を欠損値に代入する
ちなみに、median()は平均値を取得する
# 近隣でグループ化し、グループのLotFrontageの平均値を欠損値に代入
all_data["LotFrontage"] = all_data.groupby("Neighborhood")["LotFrontage"].transform(
    lambda x: x.fillna(x.median()))
- GarageType, GarageFinish, GarageQual and GarageCond : 欠損値をNoneでうめる
for col in ('GarageType', 'GarageFinish', 'GarageQual', 'GarageCond'):
    all_data[col] = all_data[col].fillna('None')
- GarageYrBlt, GarageArea and GarageCars : 欠損値に0を入れる
for col in ('GarageYrBlt', 'GarageArea', 'GarageCars'):
    all_data[col] = all_data[col].fillna(0)
- BsmtFinSF1, BsmtFinSF2, BsmtUnfSF, TotalBsmtSF, BsmtFullBath and BsmtHalfBath : 欠損値に0を入れる
for col in ('BsmtFinSF1', 'BsmtFinSF2', 'BsmtUnfSF','TotalBsmtSF', 'BsmtFullBath', 'BsmtHalfBath'):
    all_data[col] = all_data[col].fillna(0)
- BsmtQual, BsmtCond, BsmtExposure, BsmtFinType1 and BsmtFinType2 :カテゴリカルデータの欠損値にNoneを入れる
for col in ('BsmtQual', 'BsmtCond', 'BsmtExposure', 'BsmtFinType1', 'BsmtFinType2'):
    all_data[col] = all_data[col].fillna('None')
- MasVnrArea and MasVnrType : typeの方にはNone、Areaの方には0入れる
all_data["MasVnrType"] = all_data["MasVnrType"].fillna("None")
all_data["MasVnrArea"] = all_data["MasVnrArea"].fillna(0)
- MSZoning (The general zoning classification) : ’RL’が平均値から最も遠い値である。そのため、欠損値にはRLを入れる
all_data['MSZoning'] = all_data['MSZoning'].fillna(all_data['MSZoning'].mode()[0])
- Utilities :役に立たないから削除
all_data = all_data.drop(['Utilities'], axis=1)
- Functional : NAはTypicalなのでTypを入れる
all_data["Functional"] = all_data["Functional"].fillna("Typ")
-
Electrical : 1つだけ欠損値がある。これには、sBkrkを入れる
mode():最頻値を取得する
all_data['Electrical'] = all_data['Electrical'].fillna(all_data['Electrical'].mode()[0])
- KitchenQual: 1つだけの欠損値には、最頻値を入れる
all_data['KitchenQual'] = all_data['KitchenQual'].fillna(all_data['KitchenQual'].mode()[0])
- Exterior1st and Exterior2nd : 最頻値を欠損値に入れる
all_data['Exterior1st'] = all_data['Exterior1st'].fillna(all_data['Exterior1st'].mode()[0])
all_data['Exterior2nd'] = all_data['Exterior2nd'].fillna(all_data['Exterior2nd'].mode()[0])
- SaleType :最頻値
all_data['SaleType'] = all_data['SaleType'].fillna(all_data['SaleType'].mode()[0])
- MSSubClass : NoneをNanに入れる
all_data['MSSubClass'] = all_data['MSSubClass'].fillna("None")
残りの欠損値の確認
# 欠損値が残ってないか確認
all_data_na = (all_data.isnull().sum() / len(all_data)) * 100
all_data_na = all_data_na.drop(all_data_na[all_data_na == 0].index).sort_values(ascending=False)
missing_data = pd.DataFrame({'Missing Ratio' :all_data_na})
missing_data.head()
欠損値なし
これで欠損値の処理は終わりです!
多かった、、
2. カテゴリーデータ処理
カテゴリーデータとは名義尺度や順序尺度で表されたデータのことです。
ざっくり言えば、数値以外のデータのことです!
カテゴリーデータのままだと分析や学習はできないので、数値化していきます!
順序尺度データの処理
順序尺度のデータとは、順序にのみ意味のあるデータのことです。例えば、ファストフードの飲み物のサイズ「s, M, L」をs→0, M→1, L→2のように数値化されたもののことを指します。
順序データの注意点としては、平均や標準偏差などの数値計算はできないことです。
まずは、順序データの数値を文字データに変換しておきます。(あとで、カテゴリデータをまとめて数値化するため)
# MSSubClass=The building class
all_data['MSSubClass'] = all_data['MSSubClass'].apply(str)


# Changing OverallCond into a categorical variable
all_data['OverallCond'] = all_data['OverallCond'].astype(str)


# Year and month sold are transformed into categorical features.
all_data['YrSold'] = all_data['YrSold'].astype(str)
all_data['MoSold'] = all_data['MoSold'].astype(str)
カテゴリデータを数値データに変換
LabelEncoder()で順序データと名義データをまとめて数値化していきます!
.fitでデータ選択、.transform()で数値に変換、
参考:scikit-learnのLabelEncoderの使い方
from sklearn.preprocessing import LabelEncoder
cols = ('FireplaceQu', 'BsmtQual', 'BsmtCond', 'GarageQual', 'GarageCond',
        'ExterQual', 'ExterCond','HeatingQC', 'PoolQC', 'KitchenQual', 'BsmtFinType1',
        'BsmtFinType2', 'Functional', 'Fence', 'BsmtExposure', 'GarageFinish', 'LandSlope',
        'LotShape', 'PavedDrive', 'Street', 'Alley', 'CentralAir', 'MSSubClass', 'OverallCond',
        'YrSold', 'MoSold')
# process columns, apply LabelEncoder to categorical features
for c in cols:
    lbl = LabelEncoder()
    lbl.fit(list(all_data[c].values))
    all_data[c] = lbl.transform(list(all_data[c].values))

# shape
print('Shape all_data: {}'.format(all_data.shape))
Shape all_data: (2917, 78)
補足1:新しい特徴の追加
全フロアの面積も重要であるため、TotalBsmtSFと1stSF,2ndFlrSFの合計値を新しい特陵に追加します!
# Adding total sqfootage feature
all_data['TotalSF'] = all_data['TotalBsmtSF'] + all_data['1stFlrSF'] + all_data['2ndFlrSF']
3. データを正規分布へ
機械学習においては、データが正規分布に従う方が精度がよくなると言われているらしいです!
なので、まず現在のデータの歪度(正規分布からどれだけ離れているか)を見て、Box Coxでデータを正規分布に従わせます!
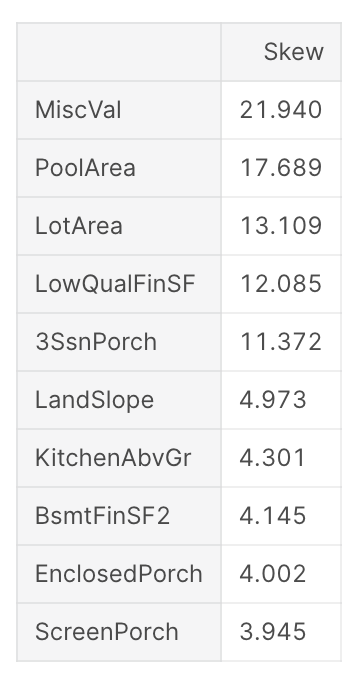
1. まずはデータの歪度
numeric_feats = all_data.dtypes[all_data.dtypes != "object"].index

# Check the skew of all numerical features
skewed_feats = all_data[numeric_feats].apply(lambda x: skew(x.dropna())).sort_values(ascending=False)
print("\nSkew in numerical features: \n")
skewness = pd.DataFrame({'Skew' :skewed_feats})
skewness.head(10)

やはり、正規分布ではない特徴が複数見られますね!
2. BoxCoxで正規分布へ変換!
skewness = skewness[abs(skewness) > 0.75]
print("There are {} skewed numerical features to Box Cox transform".format(skewness.shape[0]))

from scipy.special import boxcox1p
skewed_features = skewness.index
lam = 0.15
for feat in skewed_features:
    #all_data[feat] += 1
    all_data[feat] = boxcox1p(all_data[feat], lam)

# all_data[skewed_features] = np.log1p(all_data[skewed_features])
4. 最後にカテゴリカルな特徴にダミー変数を追加!
ダミー変数を使うと、カテゴリカルデータを0,1で表すように変数がセットされます。
参考:ダミー変数の作り方と注意点について
all_data = pd.get_dummies(all_data)
print(all_data.shape)
(2917, 220)
3. 特徴量エンジニアリング完了
これにて、データの前処理は完了しました!
合体させていた学習用とテスト用データを分割させましょう!
train = all_data[:ntrain]
test = all_data[ntrain:]
まとめ
今回はKaggleの住宅地の価格の予想のコンペのデータの前処理にフォーカスしました!
80もの特徴があり、最初はかなり大変でしたが、以下の手順で進めることでしっかりと処理できたかなと思います!
データ前処理手順
1. trainとtestデータの統合
2. 欠損値処理
3. カテゴリーデータ処理
次の記事では、実際にモデルを用いて学習して予測していきます!!
ご視聴ありがとうございました!!
