序論 / Introduction
- Splunkのダッシュボードを活用すると様々なデータを可視化することができ、状況の把握や調査をする上でとても有用です
- しかし、扱うデータの種類が増えるにつれ固有のダッシュボードを多数作成してゆくとダッシュボードの数だけ画面仕様があるような状態になり操作の複雑化を招くかもしれません
- もっとシンプルに、複数の情報を共通の操作で楽に状況を把握するためには、どういう手段が考えられるでしょうか?
- Splunk dashboards allow you to visualize a variety of data, which is very useful for understanding and investigating the situation.
- However, as the types of data you handle increase, creating many unique dashboards may lead to a situation where there are as many screen specifications as there are dashboards, which may lead to increased complexity in operation.
- What can be done to simplify the process and make it easier to understand the status of multiple pieces of information with common operations?

すべてのデータソースの概要と詳細確認をするための共通ユーザインタフェースがあればこの問題を解決できます。
A common user interface for overview and detailed review of all data sources would solve this problem.

本論 / Subject
あなたが扱うSplunkで日々確認したい情報は何でしょうか?
例えば、ビジネスやソフトウェアパフォーマンス等の色々なKPIでしょうか?
あるいは、セキュリティユースケースの場合、各種セキュリティ装置の検知やNotableイベント、Risk Object等ですか?
そういった複数のKPIや検知数の概要を1つの画面で確認するために、Splunk上に概要表示のダッシュボードを1枚用意すると役に立ちます。
What information do you want to see on a daily basis in Splunk that you handle?
For example, is it business or software performance KPIs?
Or, in the case of a security use case, is it detections of various security devices, Notable events, Risk Objects, etc.?In order to see an overview of such multiple KPIs and detections on a single screen, it is useful to have a single overview dashboard on Splunk.
概要表示ダッシュボード / Detection Summaries Dashboard
この概要画面では、日々確認したいKPIや検知数の種類ごとにパネルを横並びに配置し、
前日との比較、前週との比較ができるよう、4つの異なる時間範囲でのKPIや検知数を縦に並べて表示しています。
そして、各パネルをクリックすることで、各パネルに応じたデータソース、時間範囲の詳細が確認できる画面に遷移すると使いやすそうですね。
その際、データソース毎に別々の画面に遷移してしまうと、序論で述べたように画面仕様がたくさんできて操作の複雑化を招くかもしれません。
もちろんデータソース事の特別仕様のダッシュボードがあれば有益なこともあります。使いやすくカスタマイズしたダッシュボードをいくつでも作成できるのはSplunkの魅力の一つではあります。
ただ、扱う情報がとても多い場合、共通の操作で詳細を確認できるようにしておくことは学習コストを下げ誰でも使いやすい環境を作る上で有益でしょう。
そこで、各パネルをクリックした際、すべて同じ詳細画面へドリルダウンを行うようデザインします。
In this overview screen, panels are arranged horizontally for each type of KPI or detection count that you want to check daily,
KPIs and detection counts for four different time ranges are displayed vertically in order to allow comparison with the previous day and the previous week.It would then be easy to use if clicking on each panel would take the user to a screen where details of the data source and time range corresponding to each panel can be viewed.
In this case, if the transition is made to a separate screen for each data source, as mentioned in the introduction, many screen specifications would be created, which might lead to increased complexity of operation.
Of course, it can be beneficial to have dashboards specially tailored to each data source. The ability to create any number of easy-to-use, customized dashboards is one of the appeals of Splunk.
However, if you have a lot of information to handle, it would be beneficial to create an environment that is easy for everyone to use and lowers the learning cost by making it possible to check details using common operations.Therefore, I designed the dashboards so that when you click on each panel, you drill down to the same detailed screen for all of them.
各パネルごとにサーチしている内容も違うし、詳細画面で表示したいフィールドも違うのに、同じ詳細画面で表示できるの?
はい、できるんです!
概要画面から各パネルのサーチ内容や詳細画面で表示したいフィールド等の情報を、ドリルダウンパラメータで詳細画面へ引き継ぐことでそれを実現できます。
でも、つくるの難しいんでしょ?
いいえ、App化しましたので、Appをインストールするだけであなたがお使いのSplunkに簡単に導入できます!
Can single detail dashboard display different search contents and different fields for each drill-down source?
Yes, it can display them!
This can be achieved by using drill-down parameters to hand over information from the Summaries dashboard to the details dashboard, such as the search contents of each panel and fields to be displayed on the detail screen.But it's hard to create, right?
No, I have include it into an App so you can easily deploy it on your Splunk by simply installing the App!
詳細確認ダッシュボード / Detection Details Dashboard
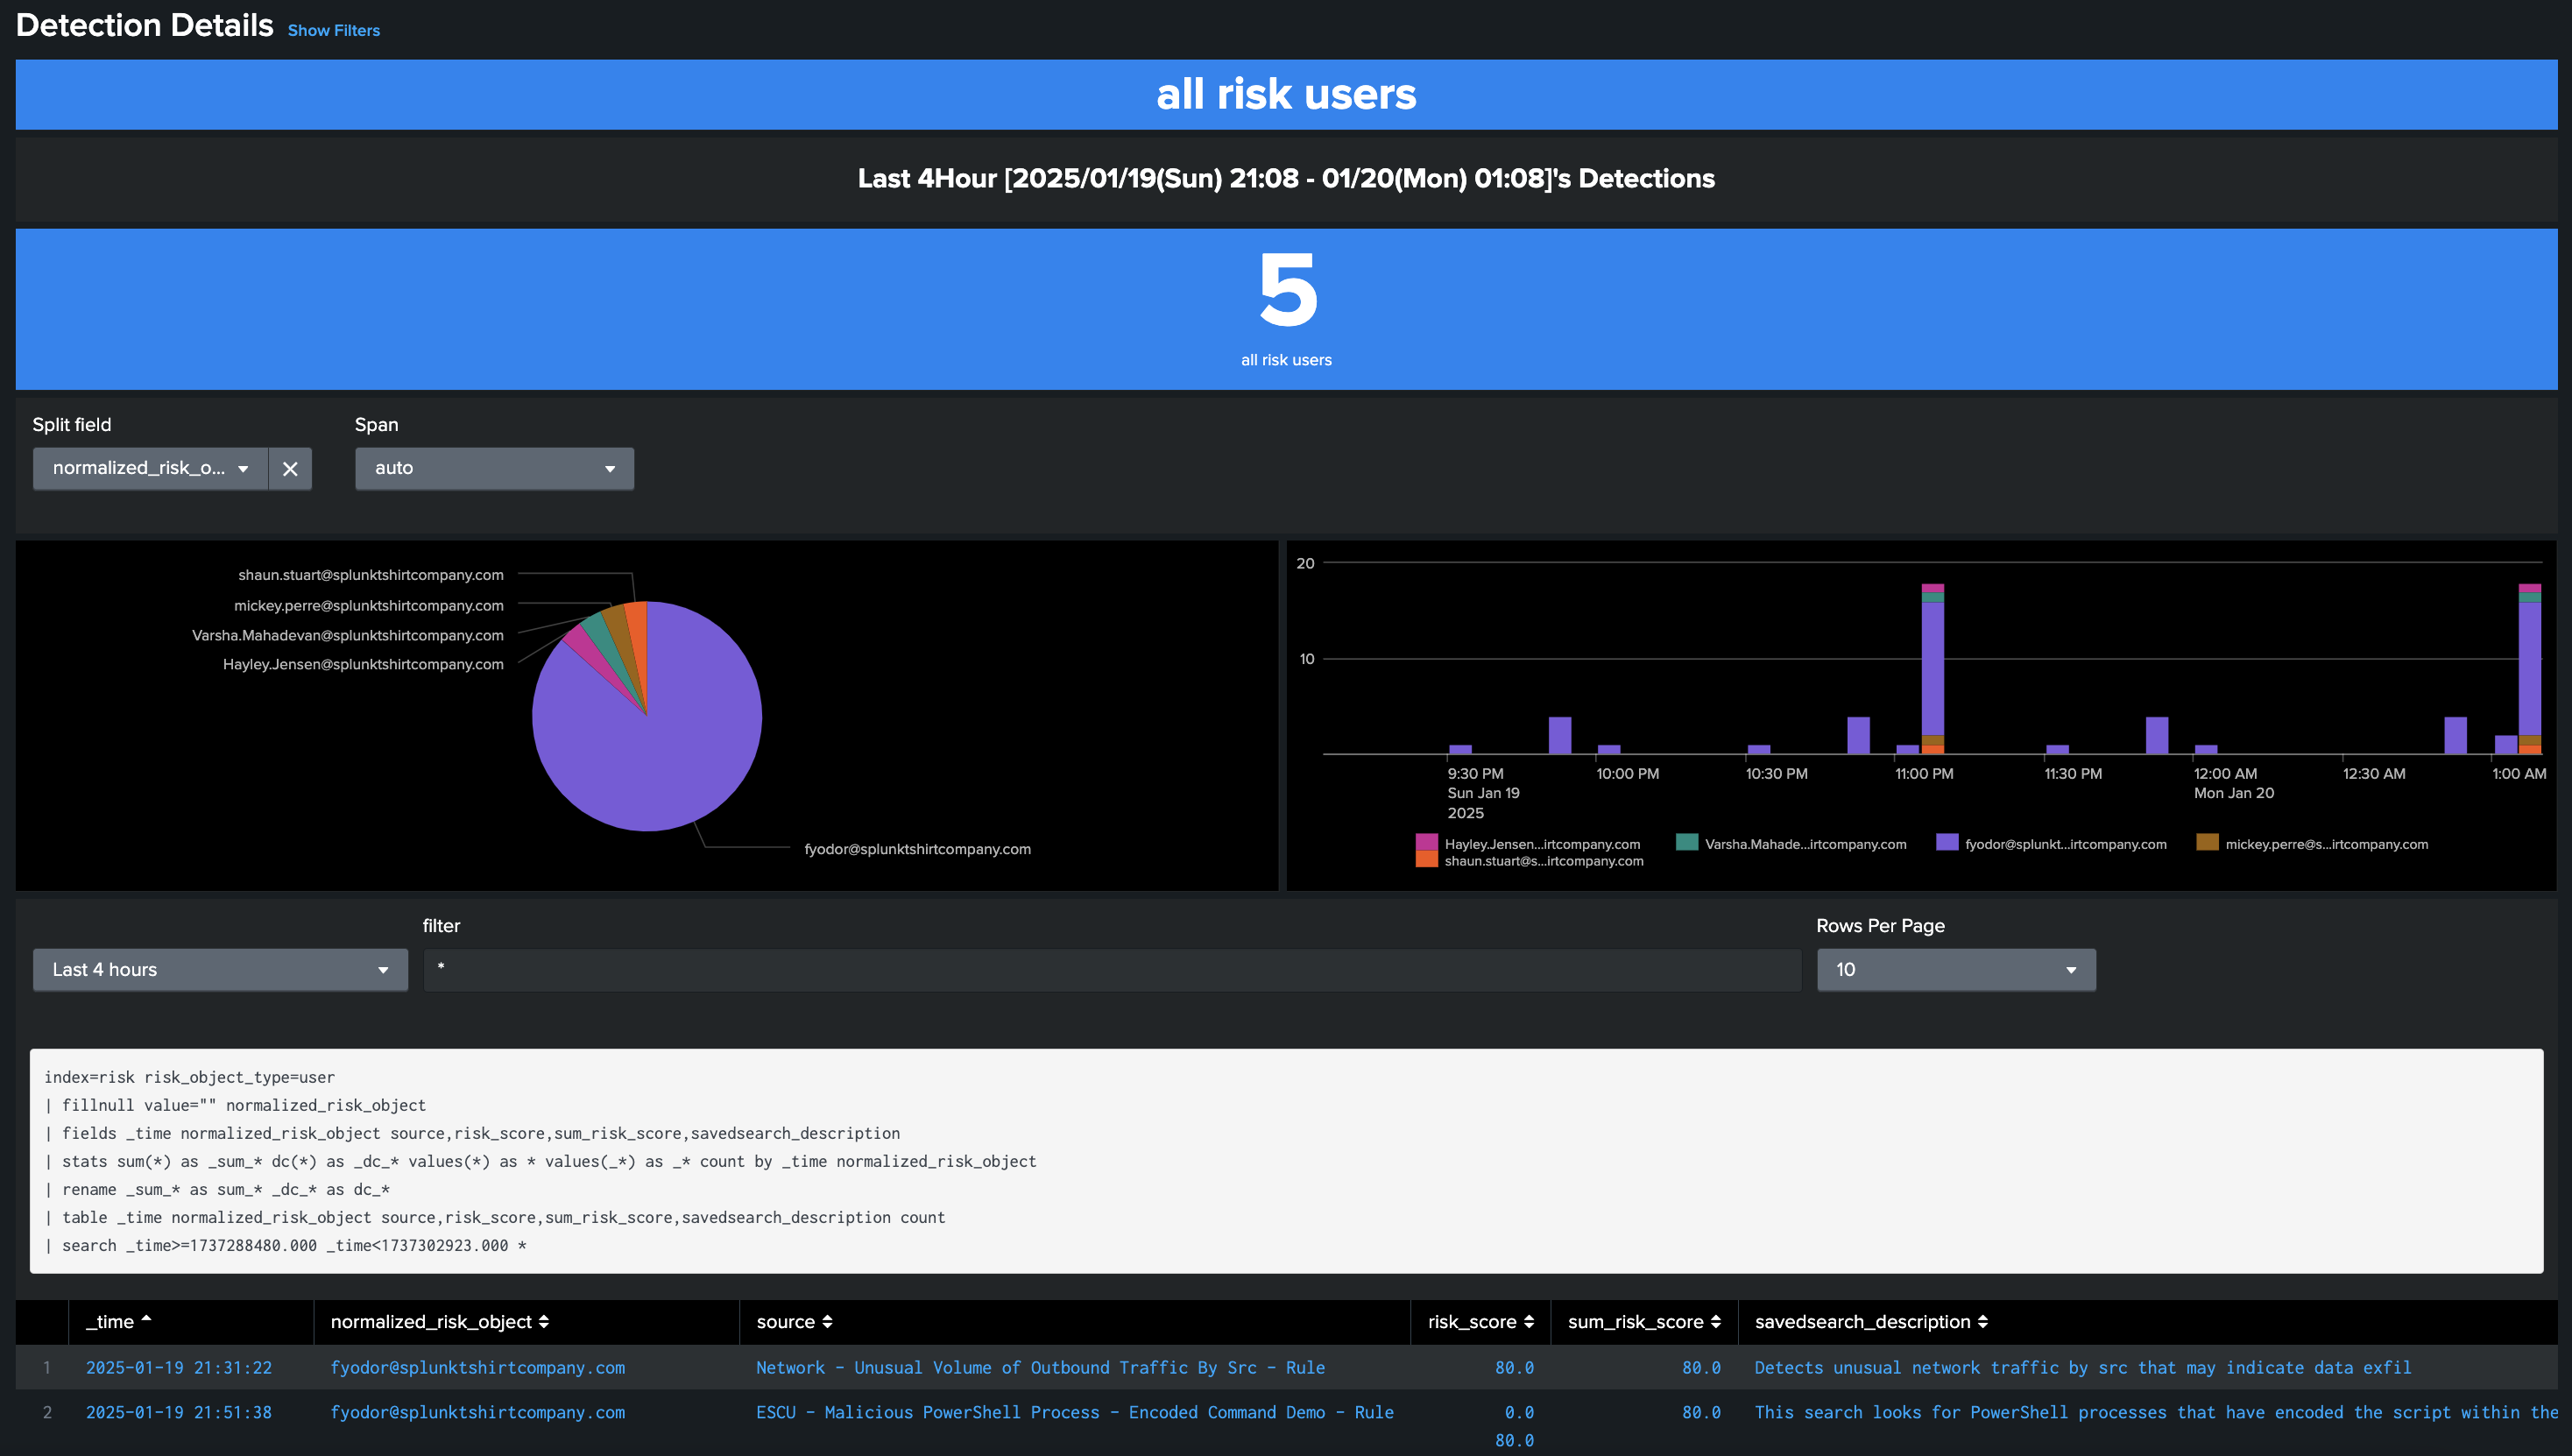
概要表示ダッシュボードからドリルダウンした詳細確認用ダッシュボードでは、データソース固有のフィールドで情報を分割して表示したり、時系列でのイベント件数推移を表示し、グラフをクリックしてイベント詳細をフィルタして確認することが可能です。
A 'Detection details' dashboard drilled down from the 'Detection summaries' dashboard displays information broken down by data source-specific fields, shows the number of events over time, and allows users to filter and check event details by clicking on the graph.
検知用マクロ管理画面 / Manage macros for detections
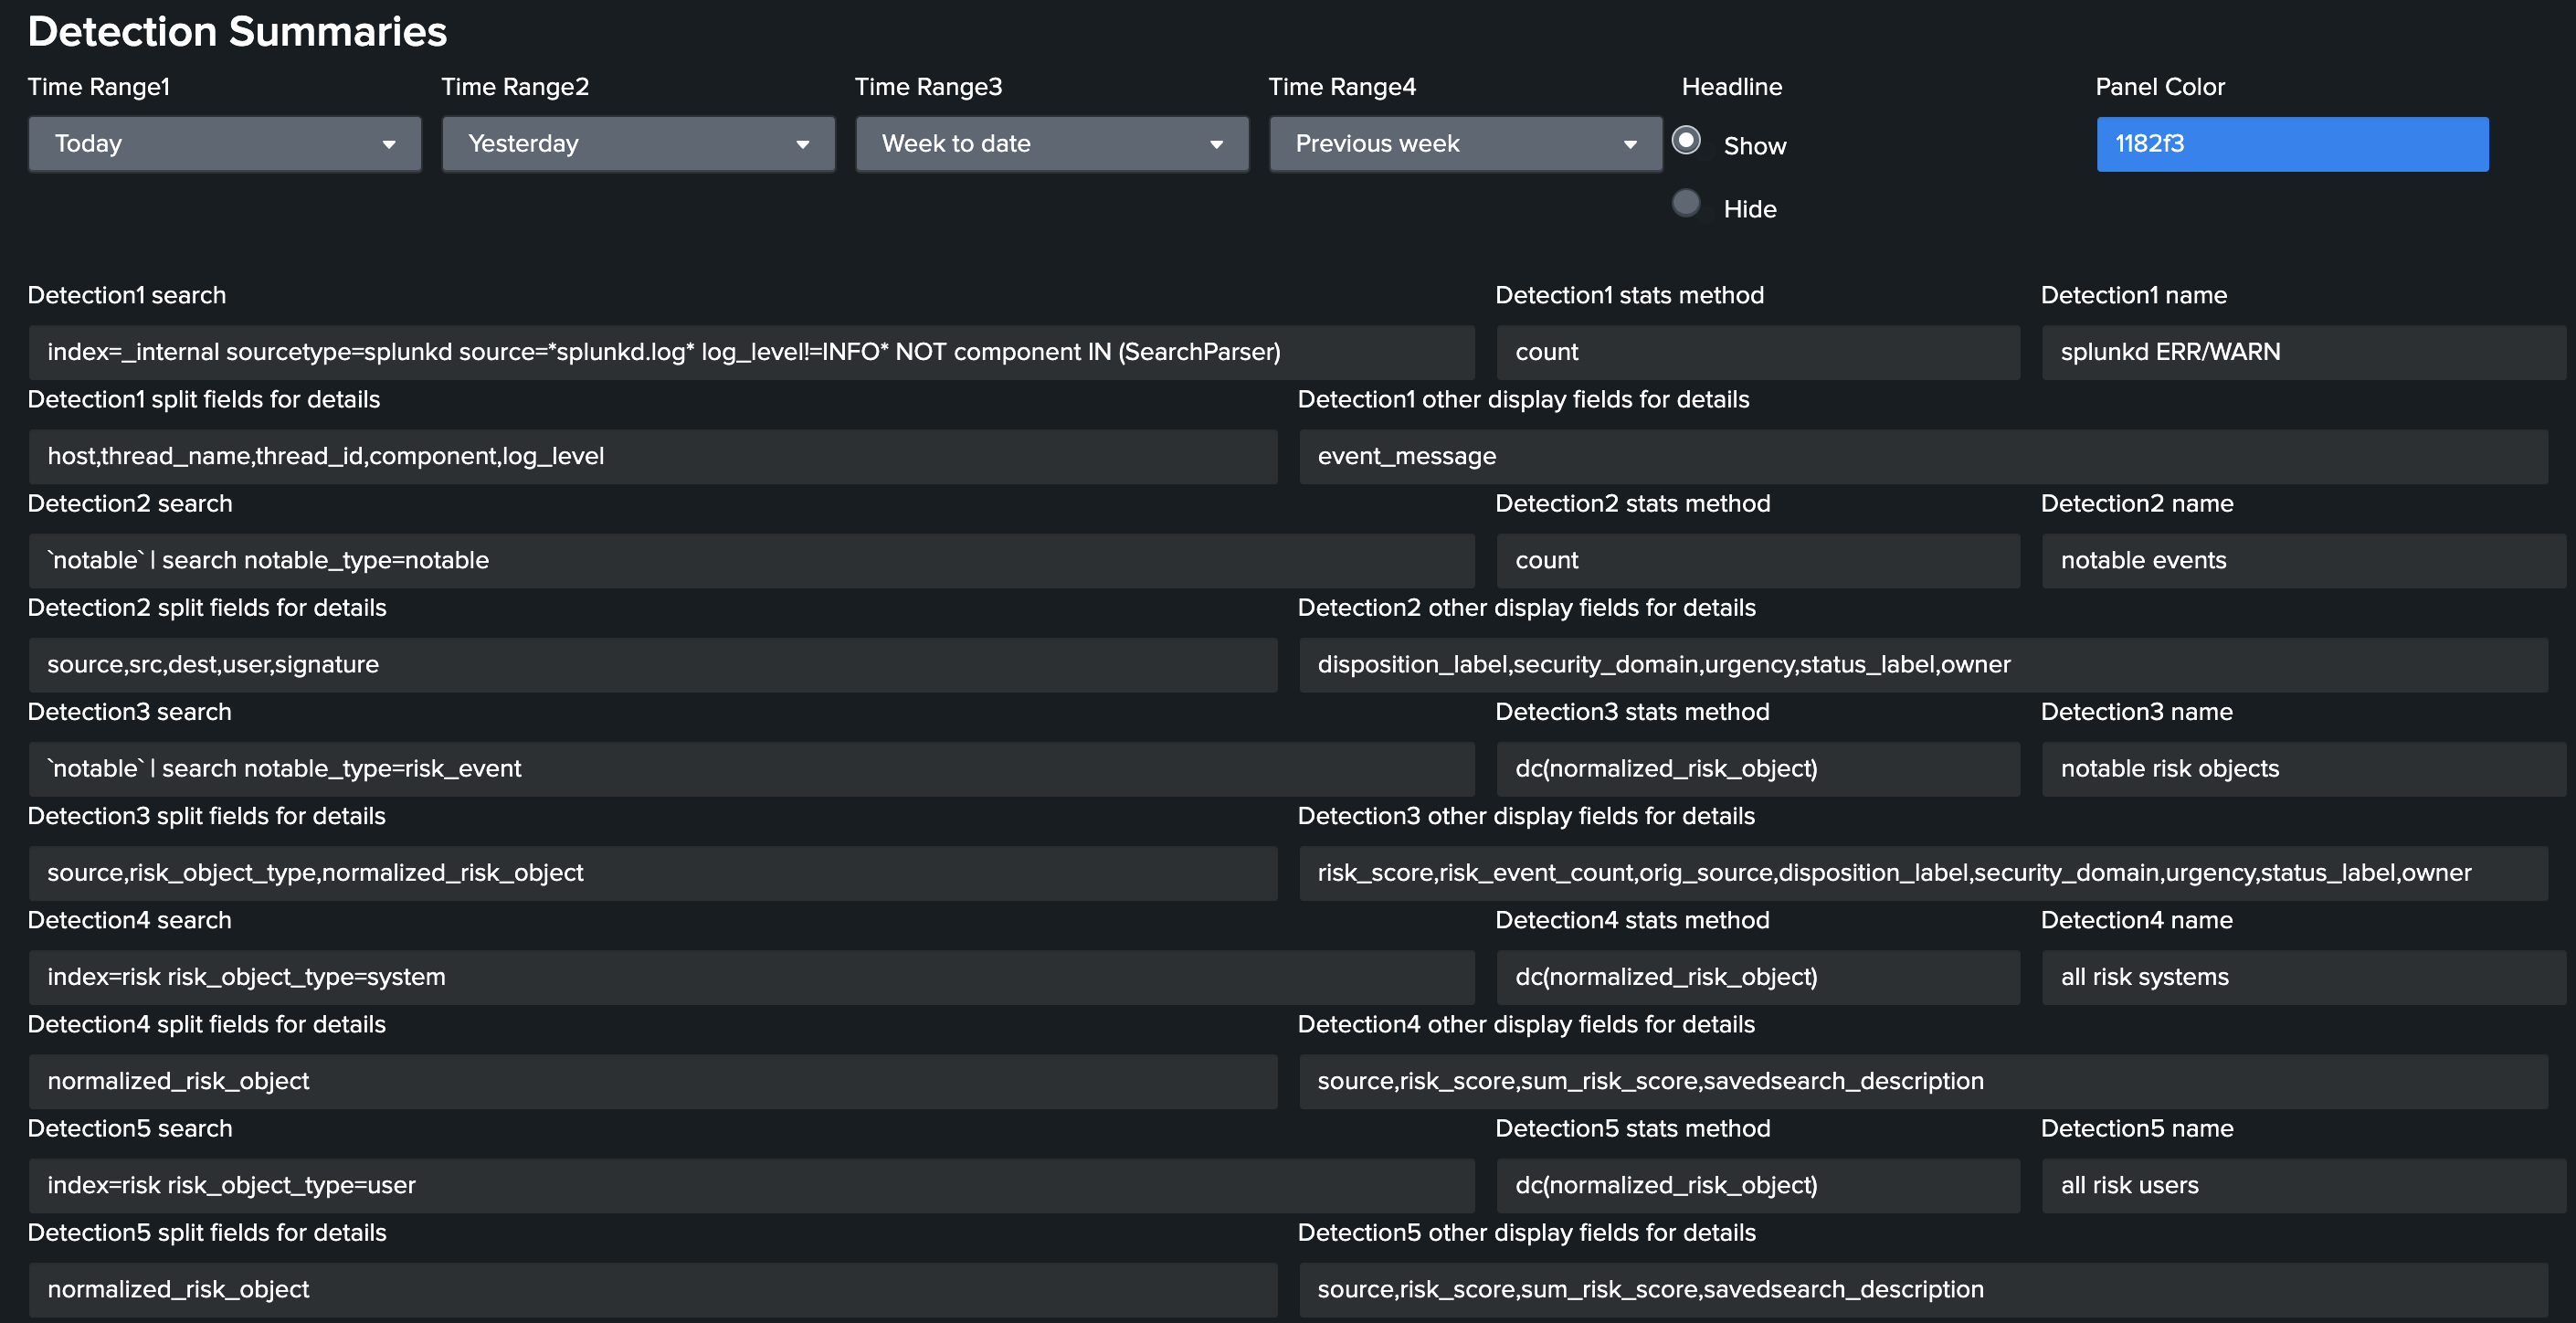
概要画面(Detection Summaries)の「フィルターを表示」をクリックすると、
各パネルのデータソースのサーチやstatsの集計方法等を変更することができます。
Click on “Show Filters” in the Detection Summaries dashboard,
you can change the data source search, stats aggregation method, etc. for each panel.
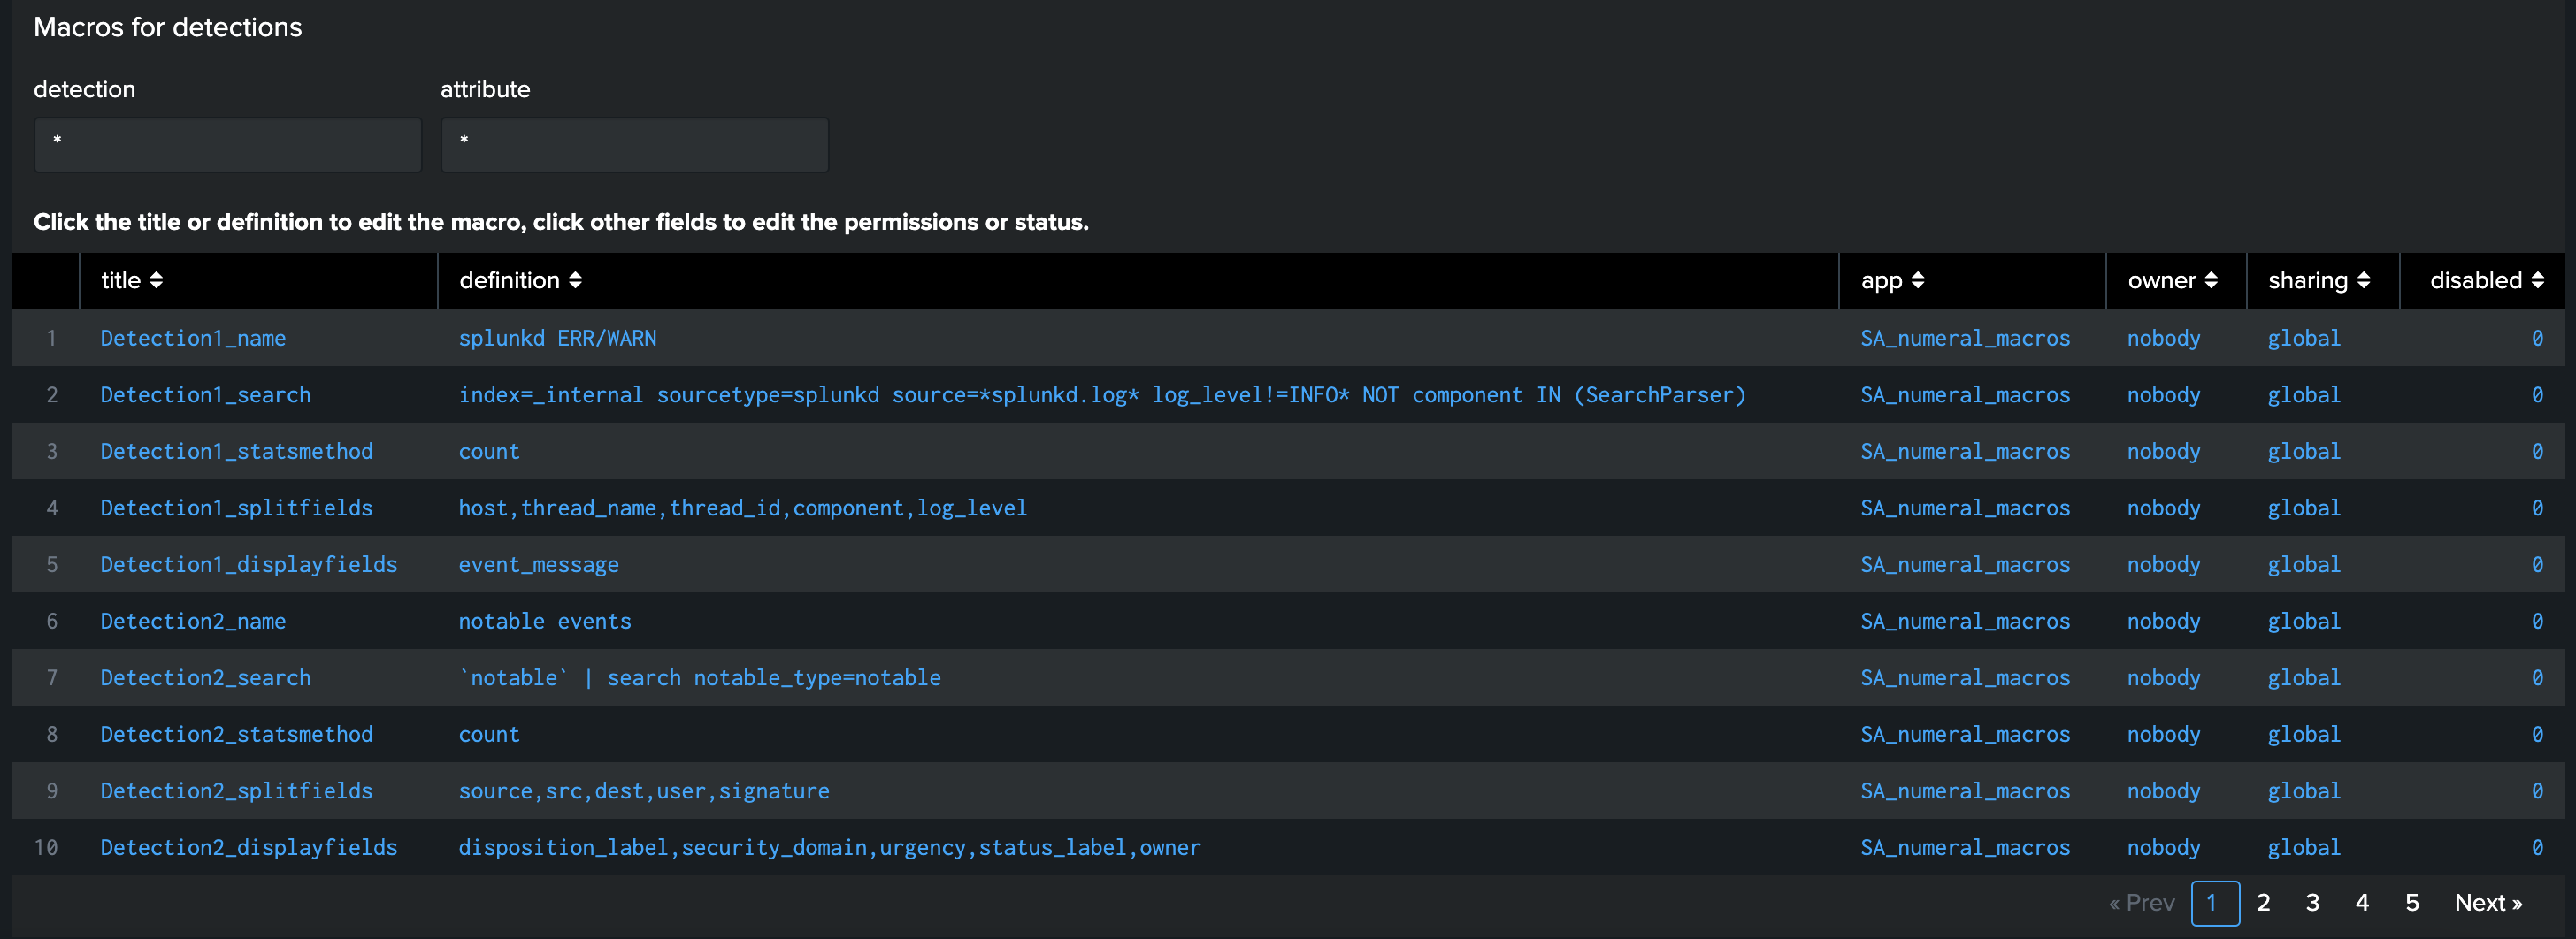
フィルタ下部の「Manage macros for detections」をクリックすると検知用マクロ管理画面が開きます。
Click 'Manage macros for detections' at the bottom of the filters to open the 'Manage macros for detections' dashboard.
「Macros for detections」パネルの「definition」フィールドをクリックし、Detection1〜Detecion9の下記マクロのdefinitionを編集します
* DetectionN_name ... 検知名
* DetectionN_search ... 検知のデータソースとなるサーチ(例: index=xxx sourcetype=yyy )
* DetectionN_statsmethod ... 検知の集計方法となるstats function(例: count )
* DetectionN_splitfields ... 詳細画面で内訳の分割対象にするフィールド(stats byの後のフィールド)
* DetectionN_displayfields ... 詳細画面で表示するその他のフィールド
Click on the 'definition' field in the 'Macros for detections' panel and edit the definitions of the following macros for Detection 1 to Detection 9
* DetectionN_name ... Name of detection N.
* DetectionN_search ... Search for a datasource for detection N.
* DetectionN_statsmethod ... A stats function to calculate statistics for detection N.
* DetectionN_splitfields ... Fields used as "stats by" arguments in the panels on the “Detection Details” dashboard.
* DetectionN_displayfields ... Fields used as "stats value(*)" arguments in the panels on the “Detection Details” dashboard.
結論 / Conclusion
シンプル、簡単、便利な共通UIの「検出サマリー」と「検出詳細」ダッシュボードは以下の手順で利用できます。
- 下記Appをインストールして「Detection Summary」ダッシュボードを開きます
- 「フィルターを表示」をクリックし、「Manage macros for detections」をクリックします
- 「Macros for detections」パネルの「definition」フィールドをクリックし、Detection1〜Detecion9用のマクロのdefinitionを編集します
Simple, easy, and useful common UI dashboards for the 'Detection summaries' and 'Detection details' are available by following the steps below.
- Install the following App and open the 'Detection Summary' dashboard
- Click the 'Show Filters' and then click 'Manage macros for detections'
- Click on the 'definition' field in the 'Macros for detections' panel and edit the definitions of macros for Detection 1 to Detection 9
アプリを入手しよう!
Get this app!
Numeral system macros for Splunk
(Please rate this app ★★★★★!)
- 「Numeral system macros for Splunk」は数値を扱うSplunkマクロを多数収録したアプリです
- マクロ以外の機能として、IPアドレスからネットワークアドレスを算出するLookup機能、SNMPのHex-String等の16進数からマルチバイト文字に変換するLookup機能も含まれています
- ver3.x.x以降で、本ドキュメントで紹介した「Detection Summaries」「Detection Details」「Manage macros for detections」ダッシュボードの機能が追加されました
“Numeral system macros for Splunk” is an application that contains many Splunk macros that handle numerical values.
In addition to macros, “Numeral system macros for Splunk” also includes a Lookup function that calculates network addresses from IP addresses, and a Lookup function that converts hexadecimal numbers such as SNMP Hex-String to multibyte characters.
The “Detection Summaries”, “Detection Details” and "Manage macros for detections" dashboard functions introduced in this document have been added in ver. 3.x.x and later.


