はじめに
理想波形をテイラー展開によって近似し,プログラムを用いてグラフに表します.
今回はeを底とする指数関数とsinとcos関数をテイラー展開します.
目次
1. 求めたい関数のテイラー展開を計算
・テイラー展開に必要なライブラリ
・求めたい理想波形
・結果
2.求めた関数のグラフを描画
・グラフ描画に必要なライブラリ
・グラフの設定
・グラフの描画
3. 参考
求めたい関数のテイラー展開を計算
テイラー展開に必要なライブラリ
求めたい関数のテイラー展開を計算するのに必要なライブラリを入れます.
from sympy import *
import numpy as np
今回はsympyとnumpyを使ってテイラー展開を計算します.
求めたい理想波形
求めたい理想波形を生成します.
# 理想波形を生成
cal_x = np.arange(-10, 10.1, 0.1)
exp_cal_y = np.exp(cal_x)
sin_cal_y = np.sin(cal_x)
cos_cal_y = np.cos(cal_x)
numpy.arange(start,stop,step)
グラフはx軸を-10から10.1の間に0.1間隔で点を生成します.
# シンボルを定義
x = Symbol("x")

# 任意点周りのテイラー展開を精度違いで計算する
exp_sol = []                                                # 結果を入れるリスト
sin_sol = []
cos_sol = []
a = 0                                                       # 任意点を指定
print("e^xのx="+str(a)+"周りのテイラー展開は")
for i in range(6):
    exp_taylor = series(exp(x), x=x, x0=a, n=i+3).removeO() # removeO()で剰余項を除去
    print("n="+str(i+2)+"のとき、")
    print(exp_taylor)                                       # 式を表示させて確認
    exp_taylor_y = lambdify(x, exp_taylor, "numpy")         # numpyの関数に変換
    exp_sol.append(exp_taylor_y(cal_x))                     # 関数に値を入れて曲線を計算

print()
print("sinxのx="+str(a)+"周りのテイラー展開は")
for i in range(6):
    sin_taylor = series(sin(x), x=x, x0=a, n=i+3).removeO()
    print("n="+str(i+2)+"のとき、")
    print(sin_taylor)
    sin_taylor_y = lambdify(x, sin_taylor, "numpy")
    sin_sol.append(sin_taylor_y(cal_x))

print()
print("cosxのx="+str(a)+"周りのテイラー展開は")
for i in range(6):
    cos_taylor = series(cos(x), x=x, x0=a, n=i+3).removeO()
    print("n="+str(i+2)+"のとき、")
    print(cos_taylor)
    cos_taylor_y = lambdify(x, cos_taylor, "numpy")
    cos_sol.append(cos_taylor_y(cal_x))
ここではa=0まわりのテイラー展開(マクローリン展開)をしていますが,別の点でもできます.
▼入力
底がeである指数関数を理想波形としたテイラー展開
sin関数を理想波形としたテイラー展開
cos関数を理想波形としたテイラー展開
▼出力
テイラー展開した形
e^xのx=0周りのテイラー展開は
n=2のとき,
x2/2 + x + 1
n=3のとき,
x3/6 + x2/2 + x + 1
n=4のとき,
x4/24 + x3/6 + x2/2 + x + 1
n=5のとき,
x5/120 + x4/24 + x3/6 + x2/2 + x + 1
n=6のとき,
x6/720 + x5/120 + x4/24 + x3/6 + x2/2 + x + 1
n=7のとき,
x7/5040 + x6/720 + x5/120 + x4/24 + x3/6 + x**2/2 + x + 1
sinxのx=0周りのテイラー展開は
n=2のとき,
x
n=3のとき,
-x3/6 + x
n=4のとき,
-x3/6 + x
n=5のとき,
x5/120 - x3/6 + x
n=6のとき,
x5/120 - x3/6 + x
n=7のとき,
-x7/5040 + x5/120 - x**3/6 + x
cosxのx=0周りのテイラー展開は
n=2のとき,
1 - x2/2
n=3のとき,
1 - x2/2
n=4のとき,
x4/24 - x2/2 + 1
n=5のとき,
x4/24 - x2/2 + 1
n=6のとき,
-x6/720 + x4/24 - x2/2 + 1
n=7のとき,
-x6/720 + x4/24 - x2/2 + 1
結果
プログラムを用いて関数をテイラー展開し,理想波形を多項式に展開(変換)しました.
求めた関数のグラフを描画
上でテイラー展開して求めた関数をグラフに描画します.
グラフ描画に必要なライブラリ
グラフに描画するのに必要なライブラリを入れます.
import matplotlib.pyplot as plt
今回はmatplotlibを使ってグラフを描画します.
グラフの設定
どのようなグラフを作りたいか,フォントやスケールの大きさなどを設定します.
# フォントのサイズと種類を設定
plt.rcParams["font.size"] = 10
plt.rcParams["font.family"] = 'Times New Roman'

# 目盛を内側に変更
plt.rcParams["xtick.direction"] = "in"
plt.rcParams["ytick.direction"] = "in"

# グラフのサイズを変更
fig = plt.figure(figsize = (15,5))

# グラフの位置を配分
exp_ax = fig.add_subplot(131)
sin_ax = fig.add_subplot(132)
cos_ax = fig.add_subplot(133)

# 軸のラベルとスケールを設定
exp_ax.set_xlabel('x')
exp_ax.set_ylabel('y')
exp_ax.set_xlim(-10, 10)
exp_ax.set_ylim(-10, 10)

sin_ax.set_xlabel('x')
sin_ax.set_ylabel('y')
sin_ax.set_xlim(-10, 10)
sin_ax.set_ylim(-10, 10)

cos_ax.set_xlabel('x')
cos_ax.set_ylabel('y')
cos_ax.set_xlim(-10, 10)
cos_ax.set_ylim(-10, 10)

# グラフのタイトルを設定
exp_ax.set_title("e^x")
sin_ax.set_title("sinx")
cos_ax.set_title("cosx")
グラフの描画
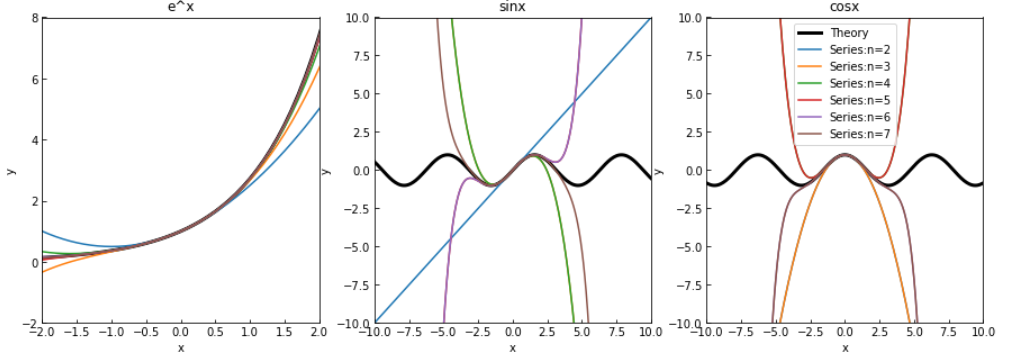
上で決めたグラフの設定を用いて,テイラー展開した関数を描画します.
# データをプロット
# 理想波形をプロット
exp_ax.plot(cal_x, exp_cal_y, label="Theory", lw=3, color="black")
# テイラー展開の結果をプロット
for j in range(len(exp_sol)):
    exp_ax.plot(cal_x, exp_sol[j], label="Series:n=" + str(j+2))

sin_ax.plot(cal_x, sin_cal_y, label="Theory", lw=3, color="black")
for j in range(len(sin_sol)):
    sin_ax.plot(cal_x, sin_sol[j], label="Series:n=" + str(j+2))

cos_ax.plot(cal_x, cos_cal_y, label="Theory", lw=3, color="black")
for j in range(len(cos_sol)):
    cos_ax.plot(cal_x, cos_sol[j], label="Series:n=" + str(j+2))

# グラフを表示
plt.legend()
plt.show()
plt.close()
参考
今回参考にさせて頂いたサイト(https://watlab-blog.com/2020/05/05/sympy-taylor-series/ )
