内閣府中央防災会議で配布している地形データを使って,津波計算コードJAGURS用の地形ファイルを作る際の留意点
JAGURSの入力ファイルはGMTのgrdフォーマットで作る必要がある.
留意点1 データのy軸の方向

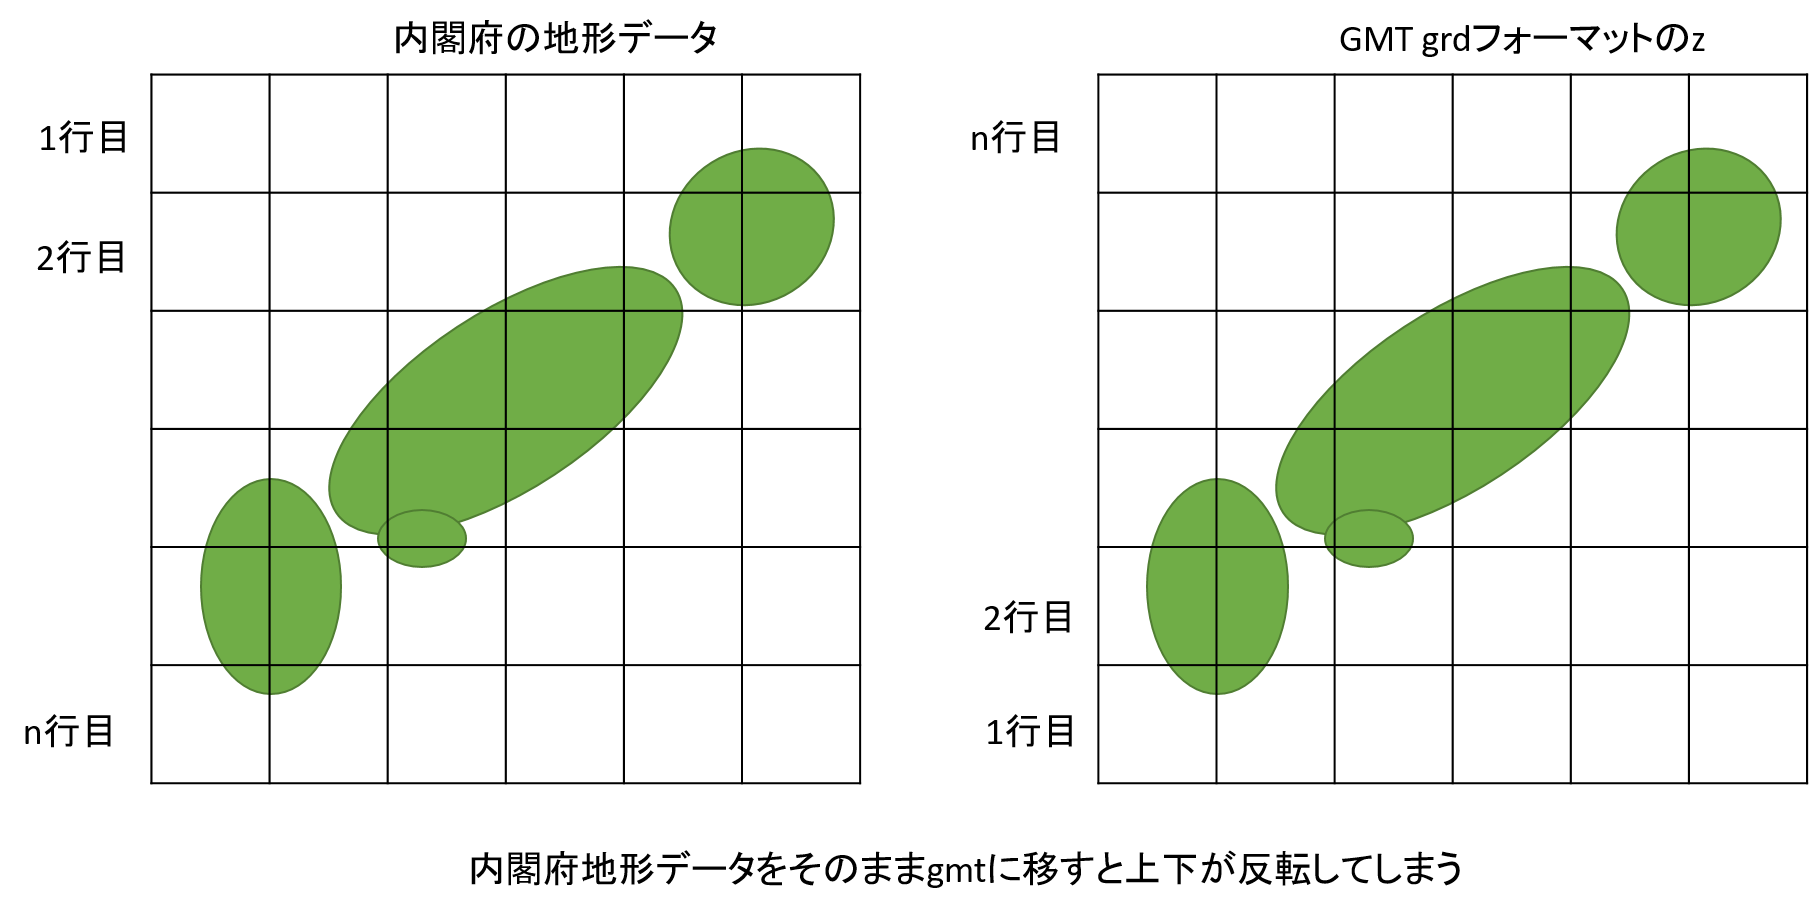
内閣府のデータは北から順にデータが入っているが,GMTのgrdフォーマット中の2次元配列は南から順に入れる必要がある.
x軸はどちらも西から東の順
留意点2 データ位置の違い
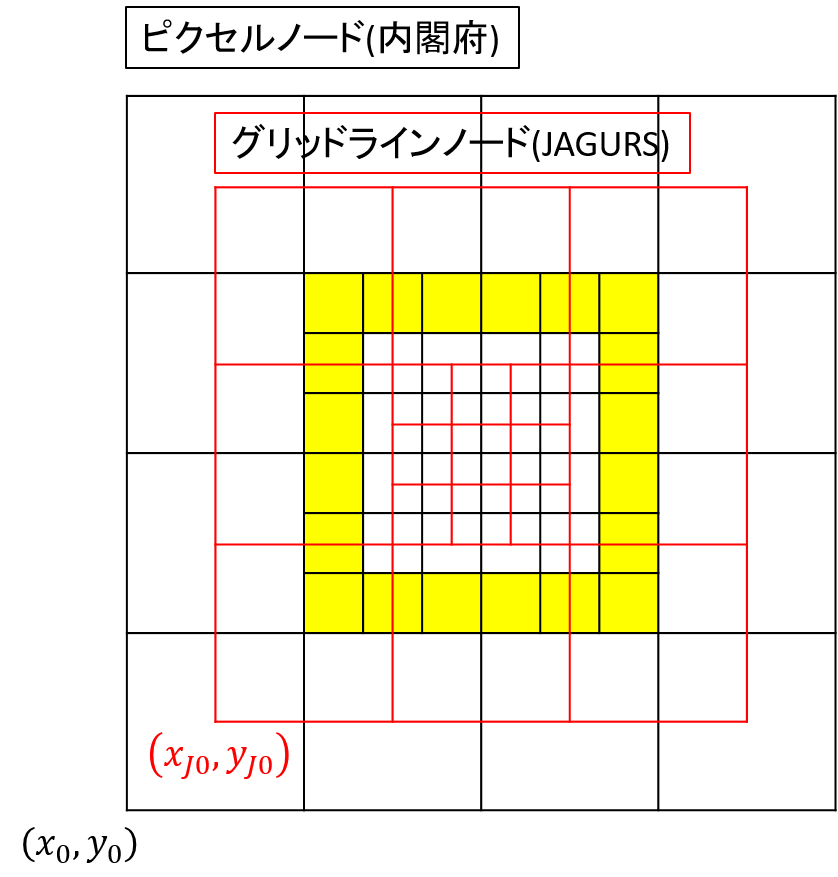
- 内閣府データはピクセルノード(格子の真ん中に値がある)
- JAGURS入力用のgrdファイルはグリッドラインノード(格子のぶつかった点に値がある)
これを踏まえると,
- グリッドサイズは同じでOK
- 内閣府データの言う南西端の座標とJAGURS用のgrdフォーマットの南西端の座標は,グリッドサイズ/2だけ北東方向にズレる
ネスティングをしようと思うとさらに罠があり,JAGURSでは3:1のネスティングが可能だが,子グリッドの4角すべてがちょうど親グリッドのどこかのグリッドと一致している必要がある.
これを満たすようなデータを作るためには,内閣府データの1番外側1周分(図中の黄色のグリッド)の値を捨てればOK
サンプルコード
using GMT
using XLSX

function make_GMTgrid(x, y, z, dx, dy)
    proj4 = ""
    wkt = ""
    epsg = 0
    range = [collect(extrema(x)); collect(extrema(y)); collect(extrema(z))]
    inc = [dx, dy]
    registration = 0
    nodata = NaN
    title = ""
    remark = ""
    command = ""
    datatype = ""
    x = x
    y = y
    z = z
    x_unit = ""
    y_unit = ""
    z_unit = ""
    layout = ""

    return GMT.GMTgrid(proj4, wkt, epsg, range, inc, registration, nodata, title, remark, command, datatype, x, y, z, x_unit, y_unit, z_unit, layout)
end

cal_area_xl = "計算範囲設定_第06系.xlsx"
out_dir = "./out/"
mkpath(out_dir)
data_dir  = "./地形データ_第06系/"
cal_area = XLSX.readxlsx(cal_area_xl)

bathies = ["0810-01", "0270-02"]
for i = 1:length(bathies)
    #この辺りは,各ファイルのメッシュの情報が書かれたエクセルファイルを読み,必要なデータを取得している
    mesh_size_str = bathies[i][1:4]
    tar_sheet = cal_area[mesh_size_str * "m"][:]
    tar_sheet[ismissing.(tar_sheet)] .=""
    dx = 0
    dy = 0
    x0 = 0
    y0 = 0
    nx = 0
    ny = 0
    for j = 1:size(tar_sheet)[1]
        if tar_sheet[j,1] == bathies[i]
            dx = tar_sheet[j,2]
            dy = tar_sheet[j,2]
            x0 = tar_sheet[j,3]
            y0 = tar_sheet[j,4]
            nx = tar_sheet[j,9]
            ny = tar_sheet[j,10]
            break
        end
        if j == size(tar_sheet)[1]
            error(bathies[i] * " was not found.")
        end
    end
    #ここまでエクセルファイルの読み込み

    #留意点2の南西端の座標をずらす
    x0 = x0 + dx / 2
    y0 = y0 + dy / 2

    #後の作業のため,行と列を逆でzを作成
    z = Array{Float64}(undef,nx,ny)

    #内閣府のデータは長さ8の固定長データ.一行辺り10個の値が入っている.
    #苦肉の策で文字列として1行ずつ読み込む
    f = open(data_dir * "depth_" * bathies[i] * ".dat")
    f = readlines(f)
    #一列の実数ベクトルに直す.
    f = [parse(Float64,f[j][n*8-7:n*8]) for j = 1:length(f) for n =1:10]

    for j = 1:length(f)
        z[j] = float(f[j])
    end

    #zを転置して,行方向にy, 列方向にxの形に直す
    z = transpose(z)
    #留意点1を踏まえてy方向を逆向きに
    z = z[end:-1:1,:]

    x = collect(range(x0, length=size(z)[2], step = dx))
    y = collect(range(y0, length=size(z)[1], step = dy))

    #留意点2のネスティングについての処理.子グリッドの一番外側を取る
    if i ≠ 1
        x = x[2:end-1]
        y = y[2:end-1]
        z = z[2:end-1,2:end-1]
    end

    G = make_GMTgrid(x,y,z,dx,dy)

    #JAGURSの入力に用いるgrdファイルは=cfとしてクラシックフォーマットにしないとダメ(だった気がする)
    gmtwrite(out_dir * bathies[i] * ".grd=cf", G)
end
