シリーズ前後5つ
動機
モデルをどうやって作ろうかなと思ったときに,まずなんとなくでも理解する必要があると思って・・・。
シリーズ全体が200記事くらい書ければB級Botterにはなれるはず・・・。
LSTM
この記事を見てる人は何を今さらだと思いますが・・・。
Long short-term memoryです。
RNNに長期間の時系列データを持たせるために考えられた手法らしいです。
まあ,よくわからないですが,当方の認識としては,理論をきちんと学ぶことが大事かもしれませんが,足りない頭で考えてもしょうがないので,使えるようになることの方が大事なので,だいたいで良いような気がしてます。
さっそくやってみる
PyTorch LSTM でググったら以下の記事が出てきました。
https://dajiro.com/entry/2020/05/06/183255
あー,これこれ,やろうとしてたのこんな感じ!と思ったので,色々引用させて頂きます。
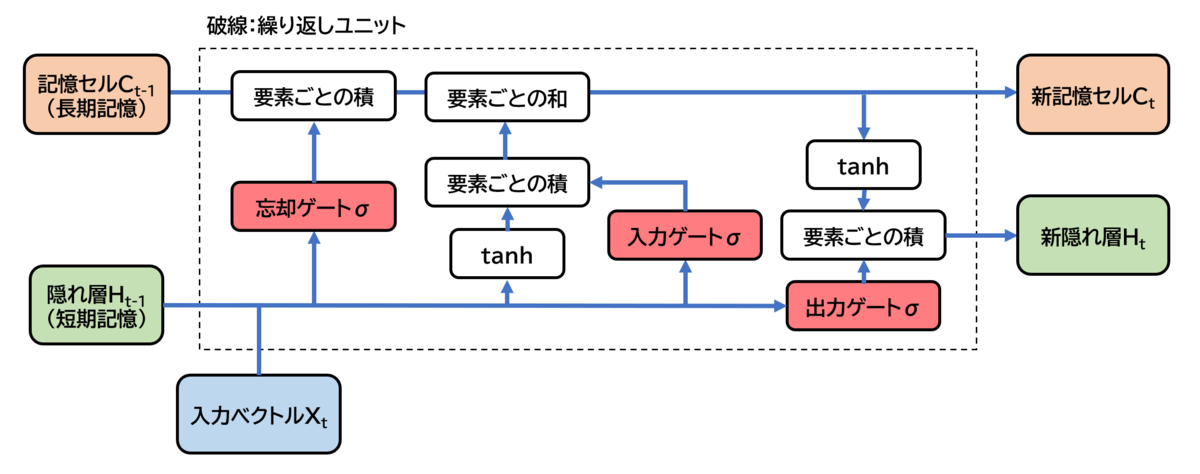
まず,LSTMの概念図です。英語ってだけで,拒絶反応が出てしまうので助かります・・・。
最近の自動翻訳はとても自然なので,まだ助かりますが・・・。
この入力ベクトルにOHLC(Open:始値,High:高値,Low:安値,Close:終値 or Volume:出来高)を入れればいいということですね!
簡潔明瞭!最高!
ただ,この図以降の説明は全くわかりませんでした・・・。
さっそくやってみる その2
この記事でチャレンジ
https://cpptake.com/archives/525
入力データは前項の説明の通り、数日分のデータを集めた「窓」と呼ばれる形に加工する必要があるので、test,trainのデータをそれぞれ加工していきます。
とありました。
ふむ,窓・・・。
さっそくやってみる その3
多変量はあんまり考えずにこれをみてやってみる。
開発環境
- Windows 10 Pro 21H1
- Python 3.9.7
- Jupyter Notebook 6.4.5
- Pandas 1.3.4
- numpy 1.20.3
- Bokeh 2.4.1
- PyTorch 1.10.1+cu113
- sklearn 0.24.2
- talib 0.4.19
- optuna 2.10.0
ソース(動いてないけど)
from math import pi
import numpy as np
import pandas as pd
import talib

from bokeh.models import LinearAxis, Range1d, CustomJS, ColumnDataSource, HoverTool, NumeralTickFormatter
from bokeh.plotting import figure, show, output_notebook
from bokeh.layouts import column
from bokeh.sampledata.stocks import MSFT

from sklearn.model_selection import train_test_split

import torch
import torch.nn as nn
import torch.nn.functional as F
from torch.utils.data import DataLoader
from torchvision import transforms
import torch.optim as optim

import optuna
optuna.logging.disable_default_handler()

# 特徴量(インジやオシレータの値)
def calc_features(df):
   open = df.open
   high = df.high
   low = df.low
   close = df.close
   volume = df.volume

   orig_columns = df.columns
   print('calc talib overlap')
# 正規分布で標準化すると外れ値に引きずられるため、最大最小で標準化する
   hilo = (df.high + df.low) / 2
   df['EMA25'] = talib.EMA(close, timeperiod=25) - hilo
   df['EMA75'] = talib.EMA(close, timeperiod=75) - hilo
   df['EMA200'] = talib.EMA(close, timeperiod=200) - hilo

   return df

def prepare_data(batch_idx, time_steps, X_data, feature_num, device):
    feats = torch.zeros((len(batch_idx), time_steps, feature_num), dtype=torch.float, device=device)
    for b_i, b_idx in enumerate(batch_idx):
        # 過去の〇〇日分をtime stepのデータとして格納する。
        b_slc = slice(b_idx + 1 - time_steps ,b_idx + 1)
        feats[b_i, :, :] = X_data[b_slc, :]

    return feats

# CUDAが使えるなら
device = torch.device("cuda" if torch.cuda.is_available() else "cpu")

# 何日先を予測するか
future_num = 1

batch_size = 128

# lstmのtimesteps
time_steps = 30
# 移動平均を取る日数
moving_average_num = 200
n_epocs = 50

lstm_hidden_dim = 16
target_dim = 1

# 変数定義
inp_dim = 0
window=200

val_idx_from = 2000
test_idx_from = 1000

dataFrame = pd.DataFrame(MSFT)
# print(dataFrame)
inp_dim = len(dataFrame)
dataFrame["date"] = pd.to_datetime(dataFrame["date"])

mids = (dataFrame.open + dataFrame.close)/2
spans = abs(dataFrame.close-dataFrame.open)

inc = dataFrame.close > dataFrame.open
dec = ~inc

# 日時表示用のフォーマットを設定(日足と分足に分岐
xaxis_dt_format = '%Y-%m-%d'
if dataFrame.iloc[0]['date'].hour > 0:
    xaxis_dt_format = '%Y-%m-%d_%H:%M:%S'
# df['DateStr'] = [pd.to_datetime(date).strftime(xaxis_dt_format) for date in df.date]


TOOLS = "pan,wheel_zoom,box_zoom,crosshair,reset,save"

p = figure(sizing_mode="stretch_both",
           tools=TOOLS,
           x_axis_type="linear",
           plot_width=1000,
           toolbar_location="left")


# Colour scheme for increasing and descending candles
INCREASING_COLOR = '#26a69a'
DECREASING_COLOR = '#ef5350'

width = 0.5
inc_source = ColumnDataSource(data=dict(
    x1=dataFrame.index[inc],
    top1=dataFrame.open[inc],
    bottom1=dataFrame.close[inc],
    high1=dataFrame.high[inc],
    low1=dataFrame.low[inc],
    Date1=dataFrame.date[inc]
))

dec_source = ColumnDataSource(data=dict(
    x2=dataFrame.index[dec],
    top2=dataFrame.open[dec],
    bottom2=dataFrame.close[dec],
    high2=dataFrame.high[dec],
    low2=dataFrame.low[dec],
    Date2=dataFrame.date[dec]
))

w = 12*60*60*1000 # half day in ms


p.title = "MSFT Candlestick"
p.xaxis.major_label_orientation = pi/4
p.grid.grid_line_alpha=0.3
p.yaxis[0].formatter = NumeralTickFormatter(format="5.3f")
# Plot candles
# High and low
p.segment(x0='x1', y0='high1', x1='x1', y1='low1', source=inc_source, color=INCREASING_COLOR)
p.segment(x0='x2', y0='high2', x1='x2', y1='low2', source=dec_source, color=DECREASING_COLOR)

# Open and close
r1 = p.vbar(x='x1', width=width, top='top1', bottom='bottom1', source=inc_source,
                fill_color=INCREASING_COLOR, line_color=INCREASING_COLOR)
r2 = p.vbar(x='x2', width=width, top='top2', bottom='bottom2', source=dec_source,
                fill_color=DECREASING_COLOR, line_color=DECREASING_COLOR)
# Add date labels to x axis
p.xaxis.major_label_overrides = {
    i: date.strftime(xaxis_dt_format) for i, date in enumerate(pd.to_datetime(dataFrame.date))
}

# Set up the hover tooltip to display some useful data
p.add_tools(HoverTool(
    renderers=[r1],
    tooltips=[
        ("Open", "$@top1"),
        ("High", "$@high1"),
        ("Low", "$@low1"),
        ("Close", "$@bottom1"),
        ("Date", "@Date1{" + xaxis_dt_format + "}"),
    ],
    formatters={
        '@Date1': 'datetime',

    },
    mode='vline', # 縦線に相当する値を表示
    # mode='mouse',  # マウスポインタを合わせたときに表示
))

p.add_tools(HoverTool(
    renderers=[r2],
    tooltips=[
        ("Open", "$@top2"),
        ("High", "$@high2"),
        ("Low", "$@low2"),
        ("Close", "$@bottom2"),
        ("Date", "@Date2{" + xaxis_dt_format + "}")
    ],
    formatters={
        '@Date2': 'datetime',
    },
    mode='vline', # 縦線に相当する値を表示
    # mode='mouse',  # マウスポインタを合わせたときに表示
))
# output_file("candlestick.html", title="candlestick.py example")


output_notebook()  # 出力先をノートブックへ

# show(p)  # open a browser

future_price = dataFrame.iloc[future_num:]['close'].values
curr_price = dataFrame.iloc[:-future_num]['close'].values

calc_features(dataFrame)
mdf = dataFrame


mdf.pop(mdf.columns[0])
cols = mdf.columns.values
# print(cols)
# print("MDF")
# print(mdf)

feature_num =len(cols)

X_data = mdf.iloc[moving_average_num:-future_num][cols].values
print('dataFrame')
print(dataFrame.iloc[moving_average_num:-future_num][dataFrame.columns.values].values)
print('mdf')
print(X_data)

# データの分割、TorchのTensorに変換
# 学習用データ
X_train = torch.tensor(X_data[:val_idx_from], dtype=torch.float, device=device)
# 評価用データ
X_val   = torch.tensor(X_data[val_idx_from:test_idx_from], dtype=torch.float, device=device)
# テスト用データ
X_test  = torch.tensor(X_data[test_idx_from:], dtype=torch.float, device=device)

# 学習
model = LSTMClassifier(feature_num, lstm_hidden_dim, target_dim).to(device)
loss_function = nn.BCELoss()
optimizer= optim.Adam(model.parameters(), lr=1e-4)

train_size = X_train.size(0)
best_acc_score = 0

for epoch in range(n_epocs):
    # trainデータのindexをランダムに入れ替える。最初のtime_steps分は使わない。
    perm_idx = np.random.permutation(np.arange(time_steps, train_size))
    for t_i in range(0, len(perm_idx), batch_size):
        batch_idx = perm_idx[t_i:(t_i + batch_size)]
        # LSTM入力用の時系列データの準備
        feats = prepare_data(batch_idx, time_steps, X_train, feature_num, device)
        y_target = y_train[batch_idx]
        model.zero_grad()
        train_scores = model(feats) # batch size x time steps x feature_num
        loss = loss_function(train_scores, y_target.view(-1, 1))
        loss.backward()
        optimizer.step()

    # validationデータの評価
    print('EPOCH: ', str(epoch), ' loss :', loss.item())
    with torch.no_grad():
        feats_val = prepare_data(np.arange(time_steps, X_val.size(0)), time_steps, X_val, feature_num, device)
        val_scores = model(feats_val)
        tmp_scores = val_scores.view(-1).to('cpu').numpy()
        bi_scores = np.round(tmp_scores)
        acc_score = accuracy_score(y_val[time_steps:], bi_scores)
        roc_score = roc_auc_score(y_val[time_steps:], tmp_scores)
        f1_scores = f1_score(y_val[time_steps:], bi_scores)
        print('Val ACC Score :', acc_score, ' ROC AUC Score :', roc_score, 'f1 Score :', f1_scores)

    # validationの評価が良ければモデルを保存
    if acc_score > best_acc_score:
        best_acc_score = acc_score
        torch.save(model.state_dict(),model_name)
        print('best score updated, Pytorch model was saved!!', )

# bestモデルで予測する。
model.load_state_dict(torch.load(model_name))

with torch.no_grad():
    feats_test = prepare_data(np.arange(time_steps, X_test.size(0)), time_steps, X_test, feature_num, device)
    val_scores = model(feats_test)
    tmp_scores = val_scores.view(-1).to('cpu').numpy()
    bi_scores = np.round(tmp_scores)
    acc_score = accuracy_score(y_test[time_steps:], bi_scores)
    roc_score = roc_auc_score(y_test[time_steps:], tmp_scores)
    f1_scores = f1_score(y_test[time_steps:], bi_scores)
    print('Test ACC Score :', acc_score, ' ROC AUC Score :', roc_score, 'f1 Score :', f1_scores)


class LSTMClassifier(nn.Module):
    def __init__(self, lstm_input_dim, lstm_hidden_dim, target_dim):
        super(LSTMClassifier, self).__init__()
        self.input_dim = lstm_input_dim
        self.hidden_dim = lstm_hidden_dim
        self.lstm = nn.LSTM(input_size=lstm_input_dim,
                            hidden_size=lstm_hidden_dim,
                            num_layers=1, #default
                            #dropout=0.2,
                            batch_first=True
                            )
        self.dense = nn.Linear(lstm_hidden_dim, target_dim)

    def forward(self, X_input):
        _, lstm_out = self.lstm(X_input)
        # LSTMの最終出力のみを利用する。
        linear_out = self.dense(lstm_out[0].view(X_input.size(0), -1))
        return torch.sigmoid(linear_out)
今日はここまで!
参考文献
Botterの定義
