Mathematica Advent Calendar 2016の5日目の記事です.
突然ですがMathematicaのPlotでグラフを描きます:
Plot[Sin[t],{t,-5,5}]
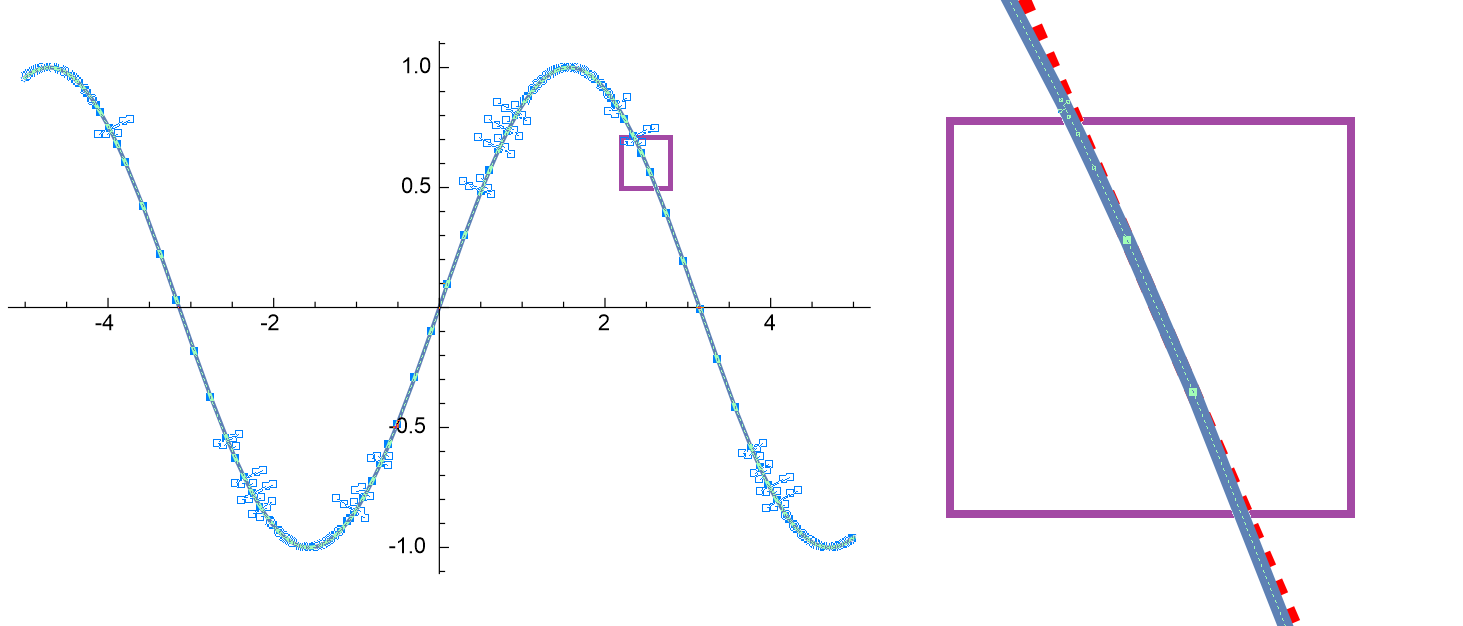
上画像はPlotをsvgで出力して, ベクタ画像編集ソフトで見たものです. (右側は拡大図と補助直線)
多数のノード(569個)から構成されており, 各セグメントは線分で構成されている事が分かります.
これを改善するのが今回紹介するBezierCurveApproximationパッケージです.
PlotBezier[Sin[t], {t, {-5, -4, -3, -2, -1, 0, 1, 2, 3, 4, 5}}]
で出力してベクタ画像編集ソフトで確認すれば

のような結果が得られます.
各セグメントがBézier曲線で近似されており, ノード数が削減(11個)されています.
インストール方法
BezierCurveApproximation.mを
https://github.com/hyrodium/BezierCurveApproximation
からダウンロードし, 適切なディレクトリに配置します.
配置場所を知るには
FileNameJoin[{$UserBaseDirectory, "Applications"}]
をMathematicaで実行します.
配置が終わったら
Needs["BezierCurveApproximation`"]
と書けばOKです.
Mathematicaのバージョン9, 10での動作を確認しています.
実行例
以降で紹介する例は全てSample.nbに含まれています.
アステロイド
{ParametricPlotBezier[{Cos[t]^3, Sin[t]^3}, {t, \[Pi]/2 Table[i, {i, 0, 4}]}],
 ParametricPlotBezier[{Cos[t]^3, Sin[t]^3}, {t, \[Pi]/4 Table[i, {i, 0, 8}]}],
 ParametricPlotBezier[{Cos[t]^3, Sin[t]^3}, {t, \[Pi]/8 Table[i, {i, 0, 16}]}]}
とすればアステロイドが出力されます.
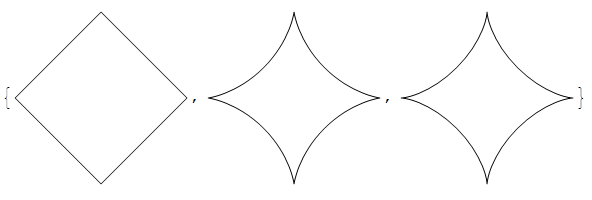
媒介変数の指定は{t,List}の形式で, List内の実数が曲線の分割点に対応します.
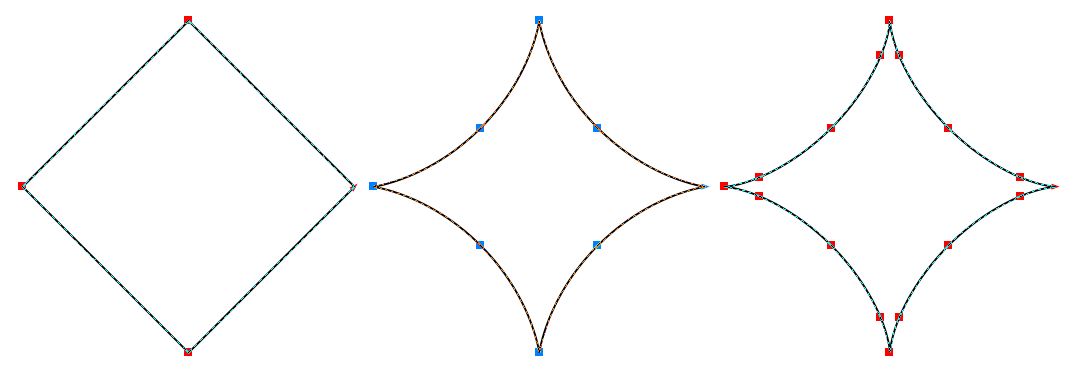
分割数が十分でないと左の例の様に近似が著しく悪くなります.
アニュラス
{ParametricPlotBezier[{s Cos[t], s Sin[t]}, {s, {0.5, 1}}, {t, \[Pi]/4 Table[i, {i, 0, 8}]}],
 ParametricPlotBezier[{s Cos[t], s Sin[t]}, {s, {0.5, 1}}, {t, \[Pi]/4 Table[i, {i, 0, 8}]}, Mesh -> {2, 4}, BoundingBox -> {{1, 1}, {-1, -1}}]}
Meshは分割するためのオプションです.
BoundingBoxは外枠を指定するためのオプションです.
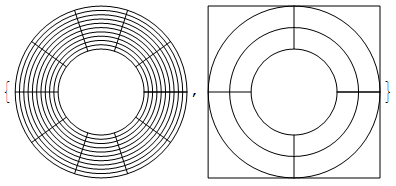
双曲放物面
{Plot3DBezier[{x y}, {x, {-1, 0, 1}}, {y, {-1, 0, 1}}, BoundingBox -> {{-1, -1, -1}, {1, 1, 1}}],
 Plot3DBezier[{x^2 - y^2}, {x, {-1, 0, 1}}, {y, {-1, 0, 1}}, BoundingBox -> {{-1, -1, -1}, {1, 1, 1}}]}
Plot3Dのような関数もあります.
ただし出力されるのは2次元の画像なので, 出力後に回転させる事は出来ません.
曲面を塗りつぶす機能は未実装です.
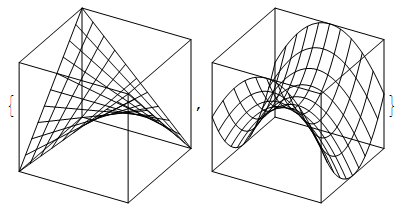
常螺旋
ParametricPlot3DBezier[{Cos[t], Sin[t], t/(2 \[Pi])}, {t, \[Pi]/4 Table[i, {i, 0, 16}]}, LngLat -> {\[Pi]/7, \[Pi]/7}]
こちらはParametricPlot3D的な関数です.
3Dの付く関数(Plot3DBezier, ParametricPlot3DBezier)はオプションLngLatで視点の角度(弧度法)が指定できます.
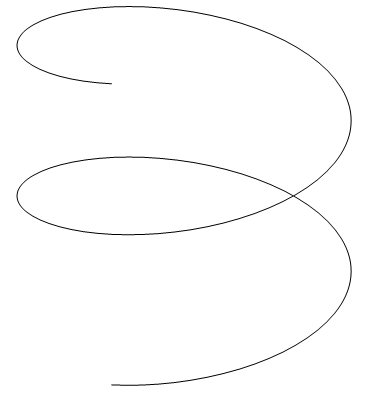
常螺旋面
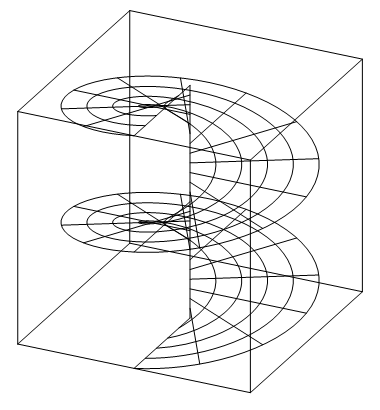
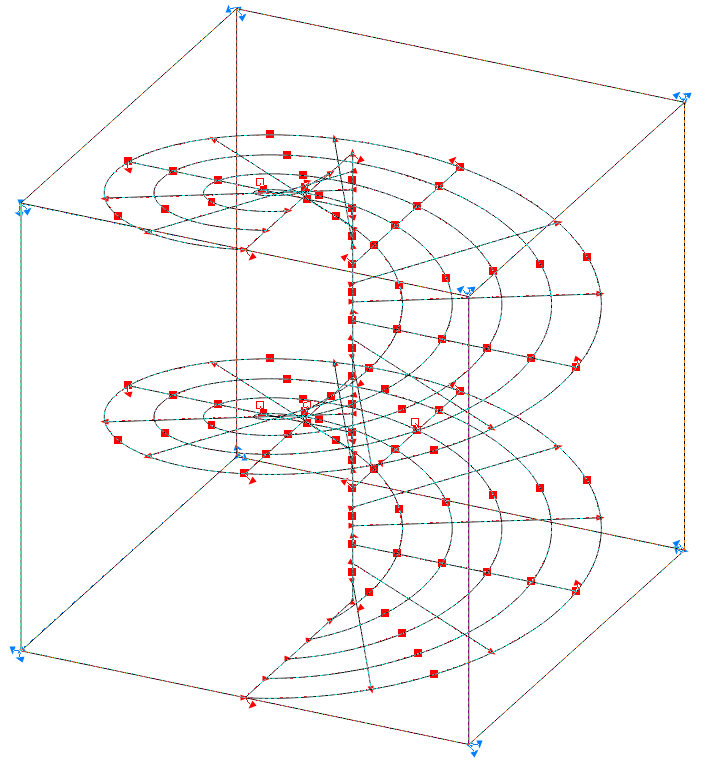
ParametricPlot3DBezier[{s Cos[t], s Sin[t], t/(2 \[Pi])}, {s, {0, 1}}, {t, \[Pi]/4 Table[i, {i, 0, 16}]}, Mesh -> {5, 24}, LngLat -> {\[Pi]/7, \[Pi]/7}, BoundingBox -> {{1, 1, 2}, {-1, -1, 0}}]
Meshの位置と曲線の分割点{t,List}は基本的には一致しません.
曲線の近似理論
このパッケージでは曲線を分割し, 各部分曲線を3次Bézier曲線で近似しています.
詳しくは
https://sites.google.com/site/hyrodium/pdfs
を参照して下さい.
要修正点
「引数を使うことで特別な意味を持つ変数」(組み込み関数のPlotやTable的なもの)の実装方法が分からなかったので, このパッケージには不具合があります.
つまり, 媒介変数が未定義の場合にしかちゃんと動作しません. 例えば
t=1.;
PlotBezier[Sin[t], {t, {-5, -4, -3, -2, -1, 0, 1, 2, 3, 4, 5}}]
など.
実装方法の分かる方, 教えてください!
(2017/08/22追記)
実装方法分かりました.
近い内に修正しようと思います..
(2017/09/11追記)
実装方法について書きました.
http://qiita.com/Hyrodium/items/1f1af6721caa3bf90871
なお, BezierCurveApproximation.mの実装の方にはまだ反映できてません.
(2017/11/14追記)
githubの方も修正しました.
https://github.com/hyrodium/BezierCurveApproximation
以上です.
