StanとRでベイズ統計モデリング Chapter 6 から
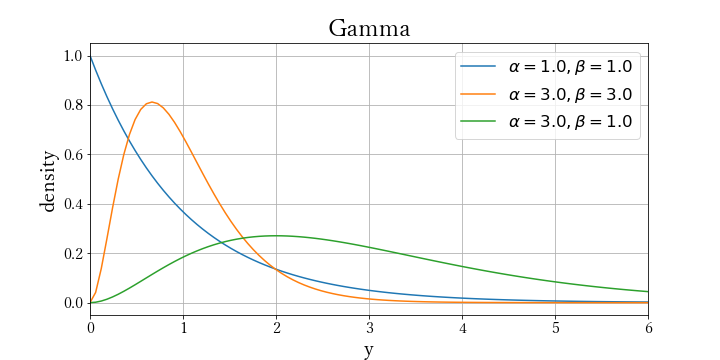
Gamma Distribution
一定期間に1回起きると期待されるランダムな事象が複数回起きるまでの時間の分布
期間1/λあたりに1回起こると期待されるランダムな事象がα回起こるまでの時間の分布
指数分布は一度イベントが一度起こるまでの間隔を表すのに対し、ガンマ分布は単位時間あたりの回数が1/βのイベントがα回起こるまでの時間間隔を表す
機械が複数の箇所が壊れてから故障する場合や、指数分布に従って起こるイベントが複数回起こる場合に用いられる。無記憶性があるのはk=1の時だけ
$ Gamma(y|\alpha,\beta) = \frac{\beta^{\alpha}}{\Gamma(\alpha)} y^{\alpha-1} exp(-\beta y) $
$ \frac{\beta^{\alpha}}{\Gamma(\alpha)} $ 積分を1にするための正規化定数
$ y $: 正の実数
$ \alpha, \beta $: 正の実数 $ \alpha $ Shape パラメータ、$ \beta $ rate パラメータ
$ E(y) = \alpha / \beta $
$ V(y) = \sqrt{\alpha} / \beta $
plt.figure(figsize=(10,5))

k = [1,3,3]
theta = [1,3,1]

x = np.linspace(0,6,100)

for i in zip(k,theta):
    rv = gamma(a=i[0], scale=1/i[1])
    y = rv.pdf(x)
    plt.plot(x, y, label=u'$ α={0:.1f}, β={1:.1f} $'.format(i[0],i[1]))

plt.xlim(0,6)
plt.grid()
plt.xlabel("y")
plt.ylabel("density")

plt.legend(fontsize='small')
plt.title("Gamma")
plt.xlabel("y")
plt.ylabel("density")
