TL; DR
GCE で立てたバッチ用インスタンス(Debian)で、
Nagios により Python スクリプトの定期実行とその結果の監視 + インスタンス自体の監視をコストをかけずにやりたい(Nagios初心者)。
が、インストールから実行まで日本語でまとまった最近の記事をググらビリティの低さゆえか見つけられなかったので、忘備録的にまとめる。
Nagios とは
CPUやメモリ、ハードディスクなどのリソースの状態やプロセスやサービスの状態、さらに、ログファイルに出力された文字列を判定して、 障害発生/解消を検知し、障害通知を行うことができる監視ツール。
Nagios XI(有料版)とNagios Core(OSS)の2種類がある。
差分についてはこちらのリンクを参照。
軽くまとめると、Nagios Core ではリソース監視/ログ監視/障害通知の最低限の機能をくれるが、グラフ表示などのビジュアライズについては別途プラグインをいれる必要がある。が、Nagios XI には、そのあたりもパッケージとして持ち、その他にもユーザに優しい機能が入っているという感じだろうか。
今回主にやりたきことは、
- バッチファイルを一日一回決まった時間に実行して、途中で失敗したらSlackに通知
- バッチ用インスタンスを監視して、インスタンス自体が動かなくなってしまう前に通知
の二つだけであり、追加・修正・変更が頻発するものでもないので、強い GUI などはそこまで必要ないため、ここでは無償版でやっていく。
補足
OSS監視ツールには、他にもZabbixやPrometheusが存在する。
が、ここでは今回選ばなかった理由を追記する。
簡単にまとめると、シンプルにやりたかったこととNagiosにはない諸々の便利な機能が今回は不要(オーバースペック)だったことが主な理由。
共通の理由
- Zabbix と Prometheus では、監視の為に取得したデータはDB上に保存されるが、Nagiosの標準ではテキストファイルに出力されるだけ。だが、今回は一日一回のバッチファイルが正常に実行されたか、実行インスタンスがちゃんと稼働しているか確認したいだけなので、特に時間帯などによる変動や長期間の傾向をとる必要はなく、チューニングなどの DB 側の運用などに特にコストを割きたくない
- Nagios では、監視の設定はテキストファイルに記述するので、変更などを Git で管理できる他、学習コストが低い(ただし、ググらビリティは試される)
Zabbix 特有の理由
Nagios では一度の値取得処理で複数の値を取得することが可能だが、Zabbix では一度のアイテム取得処理では一つの値しか取得できない。
そのため、Zabbix で Nagios のように一度に複数の値を取得するためには、zabbix_sender などと組み合わせて、1 つの値取得処理を契機に複数の値を取得して、zabbix_sender コマンドで Zabbix サーバに複数の値を送るようなスクリプトを用意して対応することになる。
今回、バッチファイルは複数動かしたい(&追加の可能性あり)ので、Zabbix のように別途対応が必要だと設定上も管理上もコストがかかるため。
Prometheus 特有の理由
Prometheus は、Naigos や Zabbix と異なり、クラウドコンテナの監視を指向しており、All in One とは違った思想で作られている。そのため、通知などの機能を別のコンポーネントで担うため、各コンポーネントを含めると Nagios と比較して構成が複雑になり、設定上も管理上もコストがかかるため。
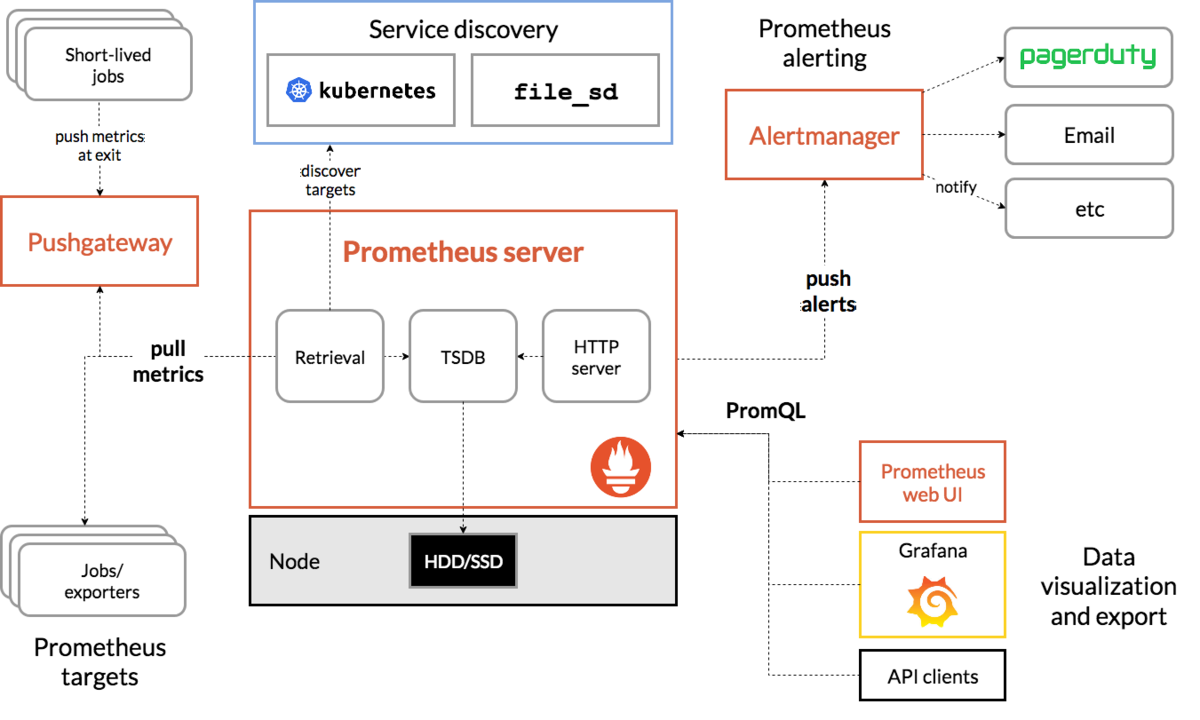
https://prometheus.io/docs/introduction/overview/#architecture より
Cron
Cron で単純に定期実行して、スクリプト内でエラーを通知することも考えたが、インスタンス自体の死活監視が面倒なので除外。 (オンプレだと別だが、今回のように GCE でやる場合は、インスタンスの死活監視は Stackdriver がよしなにしてくれるので、Cron でもよいかも、どこまで一つの構成で賄うかといった観点のお話がいるが)
Nagios(Ver 4.4.4) のインストール
前置きが長くなったが、Nagios Core をインストールしていく。GCE で既にインスタンス(Debian)が立っているところから進めていく。(その他の OS の場合も参考に示したインストールヘルプではサポートしてくれている)
※ ググると apt-get install nagios3 でインストールした手順書が散見されるが、2019/08/05 現在使えなかった。
必要なパッケージのインストール
$ sudo apt-get update
$ sudo apt-get install -y autoconf gcc libc6 make wget unzip apache2 apache2-utils php libgd-dev
ダウンロードフォルダ作成 + ソースのダウンロード
$ mkdir downloads
$ cd downloads
$ wget -O nagioscore.tar.gz https://github.com/NagiosEnterprises/nagioscore/archive/nagios-4.4.4.tar.gz
$ tar xzf nagioscore.tar.gz
ソースのコンパイル
$ cd nagioscore-nagios-4.4.3
$ ./configure --with-httpd-conf=/etc/apache2/sites-enabled
$ make all
ユーザとグループを Nagios に追加
$ sudo make install-groups-users
$ sudo usermod -a -G nagios www-data
バイナリファイルをインストール
$ sudo make install
Nagios のサービスとデーモンファイルをインストール
$ sudo make install-daemoninit
コマンドモードをインストール
$ sudo make install-commandmode
Nagios の設定ファイル(サンプル)のインストール
この設定ファイルはあくまで初期実行用のサンプルなので、後で自分のやりたいことに合わせて変更する必要がある。
$ sudo make install-config
Apache 設定ファイルのインストール
$ sudo make install-webconf
$ sudo a2enmod rewrite
$ sudo a2enmod cgi
ファイアウォールの設定
二つのコマンドでは、確認がいくつか入るが、基本 Yes で大丈夫。
$ sudo iptables -I INPUT -p tcp --destination-port 80 -j ACCEPT
$ sudo apt-get install -y iptables-persistent
Nagios の管理ユーザの作成
パスワードをお好きに設定してください。
また、将来ユーザを追加する際には、このコマンドから -c を取り除く必要がある。そうしないと、ここで作った管理ユーザがリプレスされて消えてしまうので要注意。
$ sudo htpasswd -c /usr/local/nagios/etc/htpasswd.users nagiosadmin
Apache Web Server の起動
$ sudo systemctl restart apache2.service
Nagios のサービスとデーモンの起動
$ sudo systemctl start nagios.service
ここまで来たら、Nagios の Web インターフェイスが見えるようになっているので、http://[サーバのIP]/nagios で起動しているか確認しよう。以下のような画面が表示されていれば成功。

ただし、ここではまだ Nagios-Plugin がインストールされていないので、Current Status 以下には (No output on stdout) stderr: execvp(/usr/local/nagios/libexec/check_load, ...) failed. errno is 2: No such file or directory が Critiacal Error として表示されている。
Nagios-Plugins(Ver 2.2.1) のインストール
上記のエラーを解消するために、必要な Nagios Plugins を順番にインストールしていく。ここで、おおよそインストールするが他に必要なものがあれば、このリンクを参照されたし。
必要なパッケージのインストール
$ sudo apt-get install -y autoconf gcc libc6 libmcrypt-dev make libssl-dev wget bc gawk dc build-essential snmp libnet-snmp-perl gettext
ソースのダウンロード
$ cd downloads
$ wget --no-check-certificate -O nagios-plugins.tar.gz https://github.com/nagios-plugins/nagios-plugins/archive/release-2.2.1.tar.gz
$ tar zxf nagios-plugins.tar.gz
ソースのコンパイル
$ cd nagios-plugins-release-2.2.1/
$ ./tools/setup
$ ./configure
$ sudo make
$ sudo make install
もう一度 http://[サーバの外部IP]/nagios にアクセスして、Current Status の Hosts or Services をクリックし、localhost をクリックする。
そうすると、Host Commands に Re-schedule the next check of this host というコマンドがあるので、これを実行すると、最新の状態に更新される。
これでようやく Nagios を使えるようになった。
1.1 バッチファイルの定期実行及びその監視
ここからはやりたきことを順次設定していく。まずは 1 の定期実行とその監視から。
Nagios では、いくつかの設定ファイルに設定を書き込むことで、定期的に指定したファイルを実行し、その標準出力を受け取り、それに応じてアラートを出すようにできる。
まず今回使うバッチファイル(hello.py)を、/usr/local/nagios/libexec/ に配置(コピー)。
$ sudo cp hello.py /usr/local/nagios/libexec/hello.py
配置したファイルのパーミッションを確認して、状態に応じて権限を付与する。
$ sudo chmod 755 /usr/local/nagios/libexec/hello.py
次に /usr/local/nagios/etc/objects/commands.cfg に以下のように実行したいコマンドを追記する。
define command {
    command_name    hello
    command_line    $USER1$/hello.py
}
そして /usr/local/nagios/etc/objects/templates.cfg に以下のように実行コマンドに応じた実行設定を追記。
define service {

    name                            batch-service           ; The 'name' of this service template
    active_checks_enabled           1                       ; Active service checks are enabled
    passive_checks_enabled          1                       ; Passive service checks are enabled/accepted
    parallelize_check               1                       ; Active service checks should be parallelized (disabling this can lead to major performance problems)
    obsess_over_service             1                       ; We should obsess over this service (if necessary)
    check_freshness                 0                       ; Default is to NOT check service 'freshness'
    notifications_enabled           1                       ; Service notifications are enabled
    event_handler_enabled           1                       ; Service event handler is enabled
    flap_detection_enabled          1                       ; Flap detection is enabled
    process_perf_data               1                       ; Process performance data
    retain_status_information       1                       ; Retain status information across program restarts
    retain_nonstatus_information    1                       ; Retain non-status information across program restarts
    is_volatile                     0                       ; The service is not volatile
    check_period                    batch_time              ; The service can be checked at 9:00(JST) of the day
    max_check_attempts              1                       ; Re-check the service up to 1 times in order to determine its final (hard) state
    check_interval                  60                      ; Check the service every 60 minutes under normal conditions
    retry_interval                  45                      ; Re-check the service every 45 minutes until a hard state can be determined
    contact_groups                  admins                  ; Notifications get sent out to everyone in the 'admins' group
    notification_options            w,u,c,r                 ; Send notifications about warning, unknown, critical, and recovery events
    notification_interval           60                      ; Re-notify about service problems every hour
    notification_period             24x7                    ; Notifications can be sent out at any time
    register                        0                       ; DON'T REGISTER THIS DEFINITION - ITS NOT A REAL SERVICE, JUST A TEMPLATE!
}
今回はわかりやすくするために、全部記述したが、既存の設定と重複が多い場合は、以下のように省略して、変更点のみ記述することも可能。
define service {

    name                            batch-service           ; The name of this service template
    use                             generic-service         ; Inherit default values from the generic-service definition
    check_period                    batch_time              ; The service can be checked at 9:00(JST) of the day
    max_check_attempts              1                       ; Re-check the service up to 1 times in order to determine its final (hard) state
    check_interval                  60                      ; Check the service every 60 minutes under normal conditions
    retry_interval                  45                      ; Re-check the service every 45 minutes until a hard state can be determined
}
ここでは、check_period を /usr/local/nagios/etc/objects/timeperiods.cfg において下記のように記述した batch_time (毎日日本時間で9:00 - 9:30に実行)にし、エラーを通知するまでの実行回数(max_check_attempts)を一回に、一日一回だけ実行するようにインターバル(check_interval)を設定時間間隔を超えるように60分に、失敗したときの実行インターバル(retry_interval)を45分に設定した。
# run batch file everyday once

define timeperiod {

    name                    batch_time
    timeperiod_name         batch_time
    alias                   run batch at 9:00(JST) everyday

    sunday                  00:00-00:30
    monday                  00:00-00:30
    tuesday                 00:00-00:30
    wednesday               00:00-00:30
    thursday                00:00-00:30
    friday                  00:00-00:30
    saturday                00:00-00:30
    sunday                  00:00-00:30
}
そして、上記で定義したサービステンプレートを利用して、/usr/local/nagios/etc/objects/localhost.cfg に実行するコマンド(サービス)を以下のように定義する。
# Define a service to run batch file on the local machine.

define service {
    use                     batch-service ; Name of service template to use
    host_name               localhost
    service_description     run the hello
    check_command           hello
}
ここまでで実行環境の設定は終了です。それでは、設定ファイルに誤りがないか検証していきましょう。(未定義などのミスがあれば、ここで拾うことができます。)
$ sudo /usr/local/nagios/bin/nagios -v /usr/local/nagios/etc/nagios.cfg

Nagios Core 4.4.4
Copyright (c) 2009-present Nagios Core Development Team and Community Contributors
Copyright (c) 1999-2009 Ethan Galstad
Last Modified: 2019-07-29
License: GPL

Website: https://www.nagios.org
Reading configuration data...
   Read main config file okay...
   Read object config files okay...

Running pre-flight check on configuration data...

Checking objects...
	Checked 9 services.
	Checked 1 hosts.
	Checked 1 host groups.
	Checked 0 service groups.
	Checked 1 contacts.
	Checked 1 contact groups.
	Checked 25 commands.
	Checked 6 time periods.
	Checked 0 host escalations.
	Checked 0 service escalations.
Checking for circular paths...
	Checked 1 hosts
	Checked 0 service dependencies
	Checked 0 host dependencies
	Checked 6 timeperiods
Checking global event handlers...
Checking obsessive compulsive processor commands...
Checking misc settings...

Total Warnings: 0
Total Errors:   0

Things look okay - No serious problems were detected during the pre-flight check
これで問題ないことを確認したら、設定を反映するために再起動。
$ sudo systemctl restart nagios.service
まとめると、4つファイルを更新して、nagios を再起動するだけ!
シンプルですね!(たどり着くのに時間はかかったけども)
補足
ちなみに、Linux系OS で Python スクリプトを動かす際には、ファイルの先頭に #!/usr/bin/env python3 といった shebang をつける必要があるので要注意(ハマった)。
また、処理の実行に 1 分以上かかる場合は、/usr/local/nagios/etc/nagios.cfg の以下のservicce_check_timeoutを修正する必要もあるので注意してください。この servicce_check_timeout はデフォルトが 60(sec)なので、バッチの実行にかかる時間に応じて、変更しましょう。
# TIMEOUT VALUES
# These options control how much time Nagios will allow various
# types of commands to execute before killing them off.  Options
# are available for controlling maximum time allotted for
# service checks, host checks, event handlers, notifications, the
# ocsp command, and performance data commands.  All values are in
# seconds.

service_check_timeout=600
host_check_timeout=30
event_handler_timeout=30
notification_timeout=300
ocsp_timeout=5
ochp_timeout=5
perfdata_timeout=5
ここを変更したあとは、$ sudo systemctl restart nagios.service で再起動することも忘れずに。
また、エラー出力にあたっては以下に注意してください。
まず、プログラムの exit status を Nagios プラグイン的にしよう。Nagios による監視のステータスは 4 種類 OK, WARNING, CRITICAL, UNKNOWN があり、これは Nagios プラグインの exit status にてそれぞれ 0, 1, 2, 3 に以下のように対応している。
そのため、Python スクリプトの exit status の出力をこれに合わせておきましょう。
| ステータスのラベル | EXIT STATUS の値 |
|---|---|
| OK | 0 |
| WARNING | 1 |
| CRITICAL | 2 |
| UNKNOWN | 3 |
次にエラーメッセージは標準出力に書き出すようにしよう。
Nagios の WebUI の Services のような監視項目の一覧表では Status Information というところに、メッセージが表示されるが、ここには Nagios プラグインが標準出力に書き出した 1 行目が表示される。そして、その監視項目の詳細を開くと 2 行目以降も表示される。
ということで、監視結果のステータスと合わせて伝えたい内容は、まず 1 行目に重要なことを書き、 2 行目以降により詳細な内容を書き出すようにしよう。
1.2 Nagios から Slack へアラート通知
これは簡単。Slack に公式の Nagios Integration があるので、それを使うだけ。 (手順書が古くて一部使えない部分があるので注意。)
まずは、Slack の管理画面に行きます。このアプリケーションを追加ボタンをクリックしたあとに、検索から Nagios を探して、追加します。

追加すると、セットアップの手順が出てくるので、これに従って粛々とやっていきましょう。(ファイル構成が違うところがあるので、これに従って粛々とやると通りません)
まずは、Slack の Nagios プラグインをインストールして、実行環境に移したあとにパーミッションを変更。
$ cd downloads
$ sudo apt-get install libwww-perl libcrypt-ssleay-perl
$ wget https://raw.github.com/tinyspeck/services-examples/master/nagios.pl
$ cp nagios.pl /usr/local/nagios/libexec/slack_nagios.pl
$ chmod 755 /usr/local/nagios/libexec/slack_nagios.pl
/usr/local/nagios/libexec/slack_nagios.pl を編集し、$opt_domain と $opt_token 変数を通知先の Slack に応じて設定する。
$opt_domain = "YourDomain.slack.com"; # チームドメイン
$opt_token = "NagiosServiceToken"; # Nagios サービスページのトークン
テスト投稿して、通るかどうか確かめる。
$ /usr/local/nagios/libexec/slack_nagios.pl -field slack_channel="#nagios" -field HOSTALIAS="HOSTNAME" -field SERVICEDESC="SERVICEDESC" -field SERVICESTATE="SERVICESTATE" -field SERVICEOUTPUT="SERVICEOUTPUT" -field NOTIFICATIONTYPE="NOTIFICATIONTYPE"
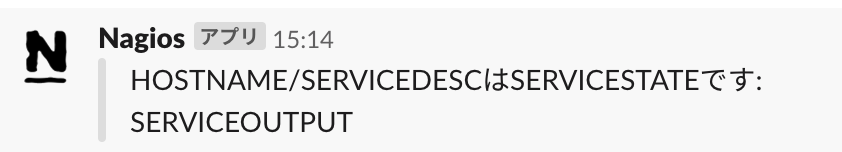
こんな感じで出てきたら、ひとまずOK!
次に Nagios の各設定ファイルに Slack の設定を追加していこう。まずは、通知先の設定usr/local/nagios/etc/objects/contacts.cfgに Slack の設定を追加します。
define contact {
      contact_name                             slack
      alias                                    Slack
      service_notification_period              24x7
      host_notification_period                 24x7
      service_notification_options             w,u,c,r
      host_notification_options                d,r
      service_notification_commands            notify-service-by-slack
      host_notification_commands               notify-host-by-slack
}

define contactgroup {
  contactgroup_name admins
  alias             Nagios Administrators
  members           nagiosadmin, slack
}
次にコマンド設定ファイル/usr/local/nagios/etc/objects/commands.cfgに通知コマンドを追加する。
define command {
	command_name		notify-service-by-slack
	command_line		/usr/local/bin/slack_nagios.pl -field slack_channel="#nagios" -field HOSTALIAS="$HOSTNAME$" -field SERVICEDESC="$SERVICEDESC$" -field SERVICESTATE="$SERVICESTATE$" -field SERVICEOUTPUT="$SERVICEOUTPUT$" -field NOTIFICATIONTYPE="$NOTIFICATIONTYPE$"
}

define command {
	command_name		notify-host-by-slack
	command_line		/usr/local/bin/slack_nagios.pl -field slack_channel="#nagios" -field HOSTALIAS="$HOSTNAME$" -field HOSTSTATE="$HOSTSTATE$" -field HOSTOUTPUT="$HOSTOUTPUT$" -field NOTIFICATIONTYPE="$NOTIFICATIONTYPE$"
}
設定に誤りがないかを検証します。
$ sudo /usr/local/nagios/bin/nagios -v /usr/local/nagios/etc/nagios.cfg
問題なかったら、Nagios をリスタート。
$ sudo systemctl restart nagios.service
実際に弄って、アラートを出してみましょう。通知タイプに応じて、色分けしてSlackに通知してくれます。
2 については、ここまでの設定でおおよそできているので、一旦終了!(疲れた。。。。)
初心者が探り探りやった感じなので、前置き含めて誤りなどありましたら、是非コメントくださいm(_ _)m
参考
[Nagios Core 公式]
(https://www.nagios.com/products/nagios-core/)
[Nagios Core/Plugin のインストールヘルプ]
(https://support.nagios.com/kb/article/nagios-core-installing-nagios-core-from-source-96.html)
[Nagios の各設定ファイルの変数名の説明]
(http://www.isl.ne.jp/it/nagios/nagios_003.html)
[Nagios の時間定義]
(https://qiita.com/mitzi2funk/items/dbc52e4944a1eeaf671d)
[How to fix service check time outs in Nagios]
(https://deadlockprocess.wordpress.com/2010/07/11/how-to-fix-service-check-time-outs-in-nagios-nrpe-deployed-in-centosrhel-5/)
[Nagios と Slack の連携]
(https://takeshiyako.blogspot.com/2014/09/slacknagios.html)
[Zabbix との比較]
(https://www.scsk.jp/product/oss/tec_guide/zabbix/1_zabbix6_1.html)
[Zabbix と Prometheus の比較]
(https://tech.willgate.co.jp/entry/2019/03/26/120553)
追記
-
強制保存:
:w !sudo tee %(よくないけど意外と使った) -
ログファイルのデフォルト位置:
/usr/local/nagios/var/nagios.log
(/usr/local/nagios/etc/nagios.cfgで変更可能) -
version:
- Latest stable release 2019-07-29 Nagios Core(ver.4.4.4)
- Nagios-Plugin 2.2.1 が最新版(2019-08-05時点)
-
本読んだほうがいいのかなぁ。でも本は多分バージョン3。。。