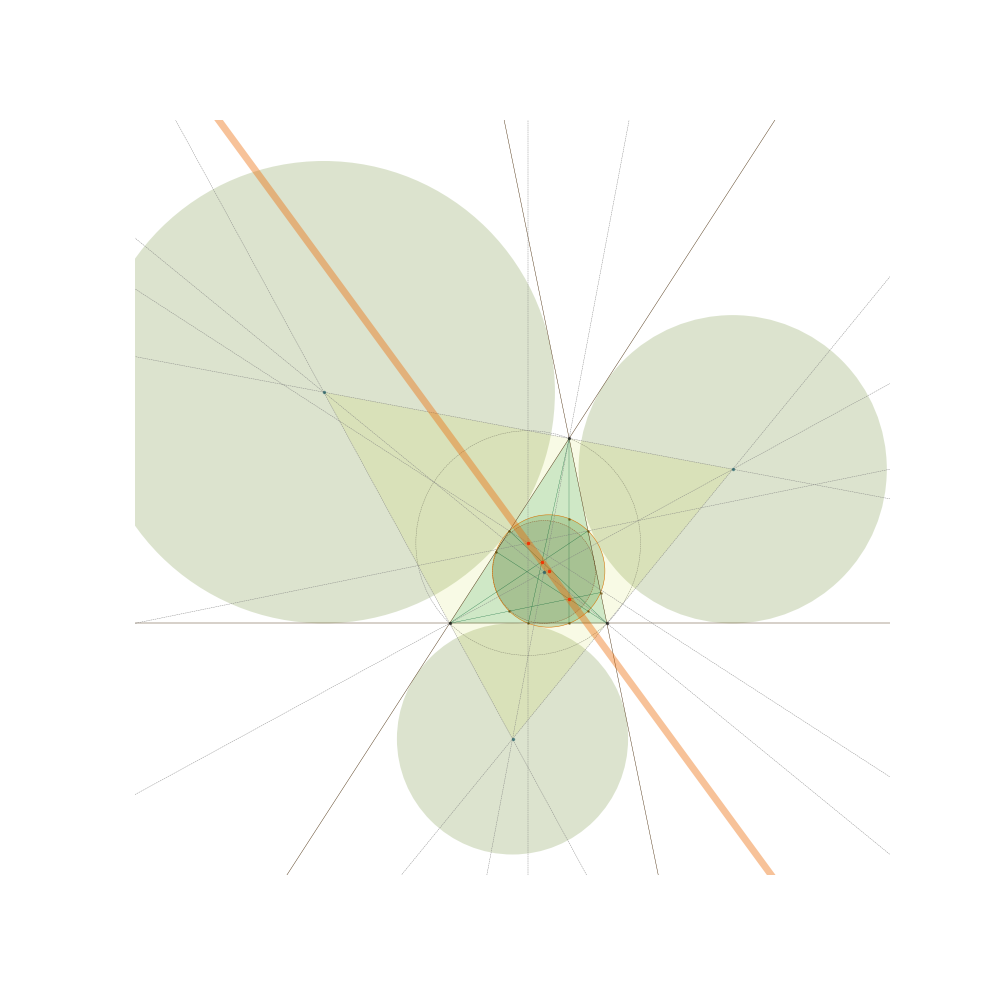
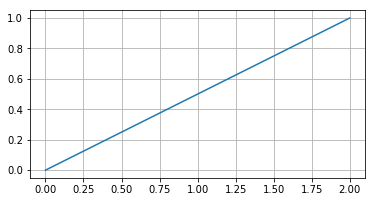
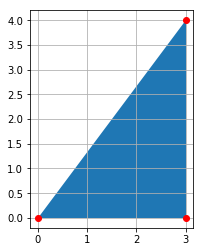
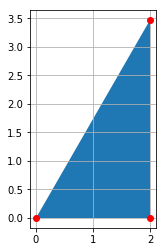
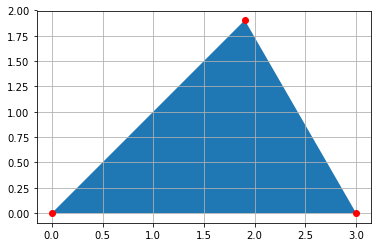
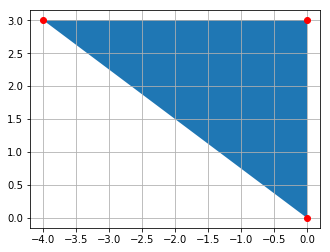
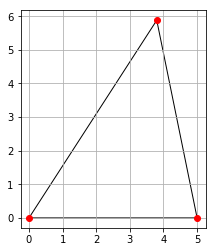
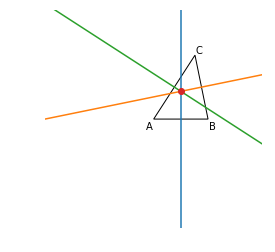
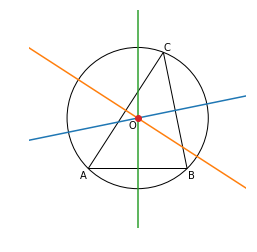
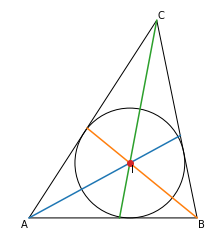
この記事は,pythonをかじったことがある人で,matplotlibを初めて使う人(つまり私)を対象に,初等幾何の集大成(は言い過ぎかな?)である九点円の図示および,フォイエルバッハの定理(九点円が内接円と傍接円に接する)が実際に正しいかを目で確認しよう,という趣旨のものです.
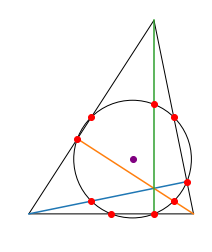
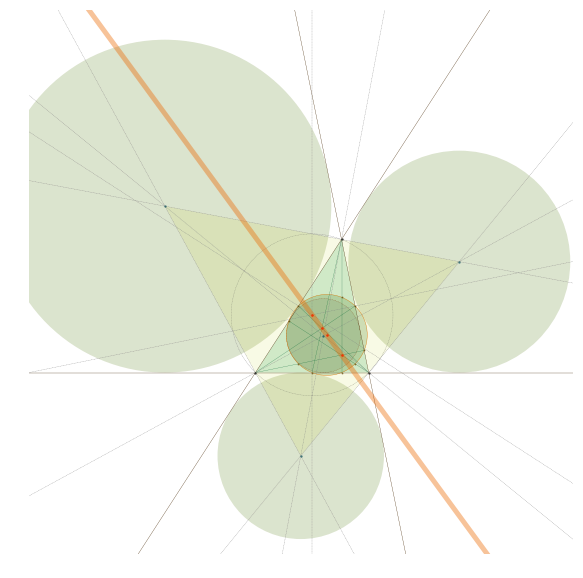
SymPyのsympy.geometry.Triangleなどを用いると,重心や内心,外心,九点円などの三角形が潜在的にもつ様々なデータを自動で計算してくれるので非常に便利です(そこはコンピュータまかせ;).最終的に,次のような図をプロットするのがゴールです.
matplotlibちょい入門
まずは必要なモジュールをインポート.
from sympy.geometry import Point, Circle, Triangle, Segment, Line
import numpy as np
import matplotlib.pyplot as plt
FigureとAxes
matplotlibについての解説はネットにいくらでもありますので,詳しくはそちらをご覧ください(私もそこまで詳しくありません).今回用いる最低限のものだけ説明します.matplotlibにはFigureとAxesという概念があるのですが,簡単にいうと,Axesという座標平面の集まりがFigureという理解で大丈夫だと思います.
fig = plt.figure() #Figureオブジェクトを生成
ax1 = fig.add_subplot(1, 2, 1) # figureを1行2列に分けた時の1番目の座標平面を生成
ax2 = fig.add_subplot(1, 2, 2) # figureを1行2列に分けた時の2番目の座標平面を生成
plt.show()
fig.add_subplot関数によって生成されたAxesオブジェクトであるax1,ax2に折れ線や円などを描写していくという流れになります.当面はAxesオブジェクトは1つで十分なので,次の記述をベースにしてきます.
fig = plt.figure() #Figureオブジェクトを生成
ax = fig.add_subplot(1, 1, 1) # figureを1行1列に分けた時の1番目の座標平面を生成
plt.show()
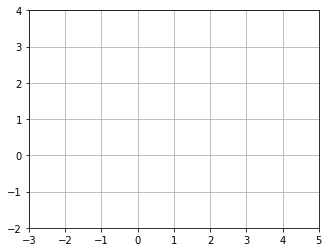
軸の範囲を指定したり,$x$ 軸と $y$ 軸の目盛りを揃えたり,グリッドを追加してみたり,画像として保存したり.
fig = plt.figure()
ax = fig.add_subplot(1, 1, 1)
ax.set_xlim(-3, 5) #-3<=x<=5 の範囲に設定
ax.set_ylim(-2, 4) #-2<=y<=4 の範囲に設定
ax.set_aspect('equal') #目盛りを揃える
ax.grid() #グリッドを表示
plt.savefig('fig.svg') #figureを画像として保存
plt.show()
折れ線を利用して線分や点を描写しよう
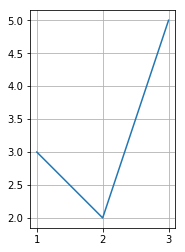
例えば,3点 $(a_1, b_1), (a_2, b_2), (a_3, b_3)$ を順に結んでできる折れ線は次のようにします.
ax.plot([a_1, a_2, a_3], [b_1, b_2, b_3])
つまり,$x$ 座標を先に並べて,それに対応する $y$ 座標を順に並べるという引数の取り方をしているのです.
fig = plt.figure()
ax = fig.add_subplot(1, 1, 1)
ax.set_aspect('equal')
ax.grid()

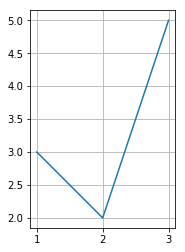
ax.plot([1, 2, 3], [3, 2, 5]) #(1, 3), (2, 2), (3, 5)を順に結んでできる折れ線

plt.show()
ここで
p1 = (1, 3)
p2 = (2, 2)
p3 = (3, 5)
という3点(タプル)に対して p1,p2,p3 を結んでできる折れ線をプロットするのにplot(p1, p2, p3)としてはValue Errorとなります.このような記法を実現するには,zip関数の出番です.zip関数は
$$\begin{align}
&[a_1, a_2,\ldots,a_n]\\
&[b_1, b_2,\ldots,b_n]
\end{align}$$
という複数のリスト(あるいはタプルなど)に対して
$$
[(a_1, b_1), (a_2, b_2),\ldots,(a_n, b_n)]
$$
という1つのリストを生成します.以下はzip関数の使用例です.
list(zip([1, 2, 3], ['a', 'b', 'c']))
[(1, 'a'), (2, 'b'), (3, 'c')]
list(zip([1, 2, 3], ['a', 'b', 'c'], ['A', 'B', 'C']))
[(1, 'a', 'A'), (2, 'b', 'B'), (3, 'c', 'C')]
p1 = (1, 3)
p2 = (2, 2)
p3 = (3, 5)
list(zip(p1, p2, p3)) # plot関数用の引数ができる
[(1, 2, 3), (3, 2, 5)]
zip関数で次のようなプロットが可能になります.
fig = plt.figure()
ax = fig.add_subplot(1, 1, 1)
ax.set_aspect('equal')
ax.grid()

p1 = (1, 3)
p2 = (2, 2)
p3 = (3, 5)

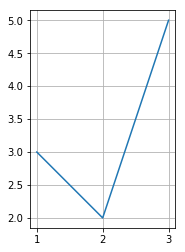
ax.plot(*zip(p1, p2, p3)) #p1, p2, p3を結んでできる折れ線
plt.show()
引数に*を付けていますが,これはリストの中身を引数として扱うための記法です.例えば
x = [x_1, x_2, x_3]
のとき,f(*x)はf([x_1, x_2, x_3])ではなく,
f(x_1, x_2, x_3)
の意味になります.
def mysum(a, b, c):
    return a + b + c

# 以下はすべて同じ結果
print(mysum(1, 2, 3))
print(mysum(*[1, 2, 3]))
print(mysum(*[1, 2], 3))
6
6
6
話を元に戻します.zipに突っ込むのはPointでもOK.
fig = plt.figure()
ax = fig.add_subplot(1, 1, 1)
ax.set_aspect('equal')
ax.grid()

p1 = Point(1, 3)
p2 = Point(2, 2)
p3 = Point(3, 5)
ax.plot(*zip(p1, p2, p3)) #p1, p2, p3を結んでできる折れ線

plt.show()
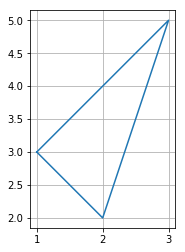
これならかなり直感的な表記だと思います.始点と終点を一致させることで,一応多角形を図示できます.
fig = plt.figure()
ax = fig.add_subplot(1, 1, 1)
ax.set_aspect('equal')
ax.grid()

p1 = Point(1, 3)
p2 = Point(2, 2)
p3 = Point(3, 5)
ax.plot(*zip(p1, p2, p3, p1)) #p1, p2, p3を頂点とする三角形

plt.show()
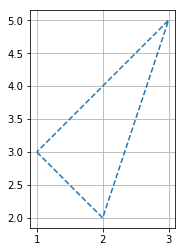
線種を破線にするには,引数に'--'を追加します.
fig = plt.figure()
ax = fig.add_subplot(1, 1, 1)
ax.set_aspect('equal')
ax.grid()

p1 = Point(1, 3)
p2 = Point(2, 2)
p3 = Point(3, 5)
ax.plot(*zip(p1, p2, p3, p1), '--') #線を破線に

plt.show()
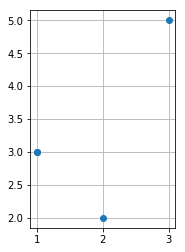
点だけを図示するには,'o'などを引数にします.
fig = plt.figure()
ax = fig.add_subplot(1, 1, 1)
ax.set_aspect('equal')
ax.grid()

p1 = Point(1, 3)
p2 = Point(2, 2)
p3 = Point(3, 5)
ax.plot(*zip(p1, p2, p3, p1), 'o') #頂点のみを表示

plt.show()
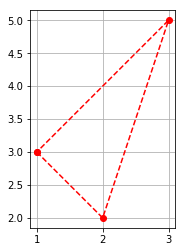
合わせ技も可能.
fig = plt.figure()
ax = fig.add_subplot(1, 1, 1)
ax.set_aspect('equal')
ax.grid()

p1 = Point(1, 3)
p2 = Point(2, 2)
p3 = Point(3, 5)

ax.plot(*zip(p1, p2, p3, p1), 'ro--') #rは赤色の意味

plt.show()
線の装飾等などについて詳しくはmatplotlib入門 - プロット方式を変更やmarkerの種類などをご覧ください.
線分や点の描写
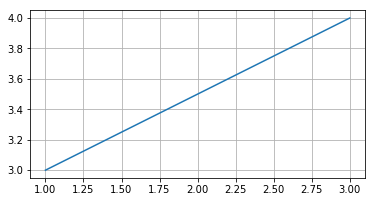
2点 $\mathrm{P}_1(1, 3), \mathrm{P}_2(3, 4)$ に対して線分 $\mathrm{P_1P_2}$ を描写するには次のようにすればOK.
fig = plt.figure()
ax = fig.add_subplot(1, 1, 1)
ax.set_aspect('equal')
ax.grid()

p1 = Point(1, 3)
p2 = Point(3, 4)
ax.plot(*zip(p1, p2))

plt.show()
点の描写もplot関数で行えます.点 $(1, 3)$ を描写するのに
p1 = Point(1, 3)
plt.plot(p1[0], p1[1], 'o')
とするよりは,やはりzip関数を使うとスッキリします(これが果たして可読性が高いといえるのかどうかは分かりませんが……).
fig = plt.figure()
ax = fig.add_subplot(1, 1, 1)
ax.set_aspect('equal')
ax.grid()

p1 = Point(1, 3)
ax.plot(*zip(p1), 'o')

plt.show()
Segmentオブジェクトから線分を図示しよう
P = Point(0, 0)
Q = Point(2, 1)
PQ = Segment(P, Q)
で,$\mathrm{P}(0, 0), \mathrm{Q}(2, 1)$ を端点とする線分 $\mathrm{PQ}$ をSegmentオブジェクトとして考えることができます.Segmentオブジェクトは.argsに端点が入ってます.
PQ.args
(Point2D(0, 0), Point2D(2, 1))
したがって ax.plot(*zip(*PQ.args)で線分 $\mathrm{PQ}$ を図示できます.
fig = plt.figure()
ax = fig.add_subplot(1, 1, 1)
ax.set_aspect('equal')
ax.grid()

ax.plot(*zip(*PQ.args))

plt.show()
ax.plot(*zip(P, Q)でも同じものが図示できますが,Segmentオブジェクトから直でプロットできるこの方法も便利です.
三角形を図示しよう
sympy.geometryのTriangleで三角形を定義します.引数は3点を与える方法と辺または角を与える方法があります.また面の概念をもつ図形はPatchというクラスに位置付けられており,折れ線とは異なりadd_patch関数で描写します.三角形の描写には,多角形を表すPolygonを使います.引数に頂点の集まりをタプルなどでセットします.
3点を指定する方法
fig = plt.figure()
ax = fig.add_subplot(1, 1, 1)
ax.set_aspect('equal')
ax.grid()

p1 = Point(1, 3)
p2 = Point(2, 2)
p3 = Point(3, 5)
t = Triangle(p1, p2, p3)

ax.add_patch(plt.Polygon(t.vertices)) #t.vertices は t の頂点のタプル

plt.show()
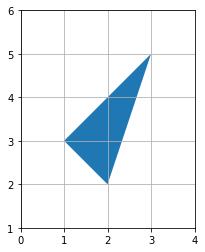
何も表示されませんでした.plot関数でプロットすると,$x$ 軸や $y$ 軸の値の範囲を自動で設定してくれますが,add_patch関数で図形を描写した場合は,デフォルトのものが使われるようです.
fig = plt.figure()
ax = fig.add_subplot(1, 1, 1)
ax.set_xlim(0, 4) #xの範囲を設定
ax.set_ylim(1, 6) #yの範囲を設定
ax.set_aspect('equal')
ax.grid()

p1 = Point(1, 3)
p2 = Point(2, 2)
p3 = Point(3, 5)
t = Triangle(p1, p2, p3)

ax.add_patch(plt.Polygon(t.vertices)) #t.vertices は t の頂点のタプル

plt.show()
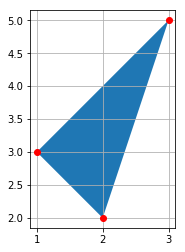
頂点もプロットしておけば一々 $x$ 軸や $y$ 軸の範囲を指定しなくても勝手にやってくれます.
fig = plt.figure()
ax = fig.add_subplot(1, 1, 1)

ax.set_aspect('equal')
ax.grid()

p1 = Point(1, 3)
p2 = Point(2, 2)
p3 = Point(3, 5)
t = Triangle(p1, p2, p3)

ax.add_patch(plt.Polygon(t.vertices))
ax.plot(*zip(*t.vertices), 'ro') #頂点を赤でプロット

plt.show()
3辺を指定する方法
Triangleには3辺の長さを指定する方法があり,こっちの方が使い勝手が良いです.
fig = plt.figure()
ax = fig.add_subplot(1, 1, 1)
ax.set_aspect('equal')
ax.grid()

t = Triangle(sss=(3, 4, 5))

ax.add_patch(plt.Polygon(t.vertices))
ax.plot(*zip(*t.vertices), 'ro')

plt.show()
この場合,原点からスタートして,$x$ 軸の正の方向へ,辺の長さが$3, 4, 5$ となるように三角形が描かれています.
2辺とその挟む角を指定する方法
sas引数に辺(side),角(angle),辺(side)の順でセットします.
fig = plt.figure()
ax = fig.add_subplot(1, 1, 1)
ax.set_aspect('equal')
ax.grid()

t = Triangle(sas=(4, 60, 2))

ax.add_patch(plt.Polygon(t.vertices))
ax.plot(*zip(*t.vertices), 'ro')

plt.show()
角度を指定した角が原点にきます.
1辺その両端の角を指定する方法
asa引数に角(angle),辺(side),角(angle)の順でセットします.
fig = plt.figure()
ax = fig.add_subplot(1, 1, 1)
ax.set_aspect('equal')
ax.grid()

t = Triangle(asa=(45, 3, 60))

ax.add_patch(plt.Polygon(t.vertices))
ax.plot(*zip(*t.vertices), 'ro')

plt.show()
原点を左端とする $x$ 軸の正の部分に指定した辺がきます.
三角形を回転させよう
sss引数は便利ですが,必ず底辺が $x$ 軸上に来てしまうので,それが嫌な場合はrotateメソッドで回転させましょう.弧度法で指定するので,あらかじめpiをインポートします.
from sympy import pi

fig = plt.figure()
ax = fig.add_subplot(1, 1, 1)
ax.set_aspect('equal')
ax.grid()

t = Triangle(sss=(3, 4, 5)).rotate(pi/2) # 90度回転

ax.add_patch(plt.Polygon(t.vertices))
ax.plot(*zip(*t.vertices), 'ro')

plt.show()
塗り潰しや辺の色など
塗り潰しをなくすにはfill引数をFalseにします.
from sympy import pi

fig = plt.figure()
ax = fig.add_subplot(1, 1, 1)
ax.set_aspect('equal')
ax.grid()

t = Triangle(sss=(5, 6, 7))

ax.add_patch(plt.Polygon(t.vertices, fill=False))
ax.plot(*zip(*t.vertices), 'ro')

plt.show()
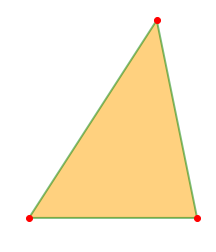
線の色や塗り潰しの色の変更,半透明にするには,次のようにします.
fig = plt.figure()
ax = fig.add_subplot(1, 1, 1)
ax.set_aspect('equal')
ax.set_axis_off() #軸の非表示

t = Triangle(sss=(5, 6, 7))

ax.add_patch(plt.Polygon(t.vertices,
                         facecolor="orange", #塗り潰しの色
                         linewidth=2, #辺の長さ
                         edgecolor="green", #辺の色
                         alpha=.5 #半透明 0=透明 1=不透明
                        ))
ax.plot(*zip(*t.vertices), 'ro')

plt.show()
変数の設定
pythonの命名規則に反するかもしれませんが,数学の伝統にならい,今後,次のような置き方を標準にします.
ABC = Triangle(sss=(5, 6, 7))
A, B, C = ABC.vertices #頂点
AB, BC, CA = Segment(A, B), Segment(B, C), Segment(C, A) #辺の設定 右辺は ABC.sidesと同等
a, b, c = BC.length, CA.length, AB.length #辺の長さ
opposides = { #頂点に対する対辺(opposite side)
    A: BC,
    B: CA,
    C: AB
}
print(AB,BC,CA)
print(*ABC.sides)
Segment2D(Point2D(0, 0), Point2D(5, 0)) Segment2D(Point2D(19/5, 12*sqrt(6)/5), Point2D(5, 0)) Segment2D(Point2D(0, 0), Point2D(19/5, 12*sqrt(6)/5))
Segment2D(Point2D(0, 0), Point2D(5, 0)) Segment2D(Point2D(19/5, 12*sqrt(6)/5), Point2D(5, 0)) Segment2D(Point2D(0, 0), Point2D(19/5, 12*sqrt(6)/5))
opposideは造語でopposite side(対辺)の略です.頂点 $\mathrm{A}$ の対辺すなわち $\mathrm{BC}$ を,Aをキーとしてアクセスできるととても便利です.
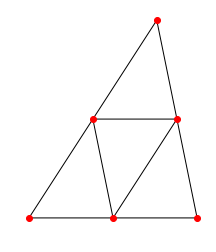
この設定だと,例えば,$\mathrm{AB}$ の中点は AB.midpoint で得ることができます.よって中点を結んでできる三角形を次のようにして図示することができます.
fig = plt.figure()
ax = fig.add_subplot(1, 1, 1)
ax.set_aspect('equal')
ax.set_axis_off()

ax.add_patch(plt.Polygon((A,B,C), fill=False))
ax.plot(*zip(A,B,C), 'ro')

ax.add_patch(plt.Polygon((BC.midpoint,CA.midpoint,AB.midpoint), fill=False))
ax.plot(*zip(BC.midpoint,CA.midpoint,AB.midpoint), 'ro')

plt.show()
文字列を表示しよう
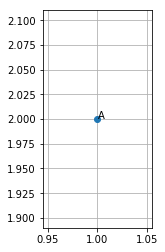
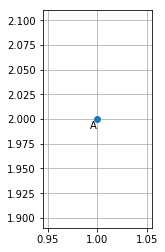
三角形の頂点の脇に $\mathrm{A}, \mathrm{B}, \mathrm{C}$ などの文字を置きたくなります.それには,text関数を用います.次の例は,点 $(1, 2)$ に $\mathrm{A}$ という文字列を配置します.
fig = plt.figure()
ax = fig.add_subplot(1, 1, 1)
ax.set_aspect('equal')
ax.grid()
ax.text(1, 2, '$\mathrm{A}$') #x座標,y座標,内容の順(TeX表記可)
ax.plot(*zip(Point(1, 2)), 'o')
plt.show()
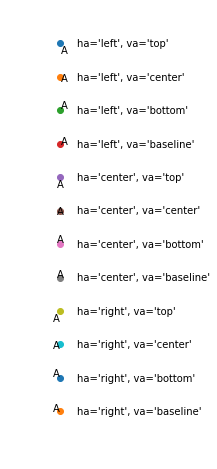
点に近いのが少し気になります.textには水平方向の位置を表すha引数(left/center/right)と,垂直方向の位置を表すva引数(top/center/bottom/baseline)があります.例えば,点 $(1, 2)$ の左下に $\mathrm{A}$ を配置するにはha='right' va='top'とセットします.
fig = plt.figure()
ax = fig.add_subplot(1, 1, 1)
ax.set_aspect('equal')
ax.grid()

ax.text(1, 2, '$\mathrm{A}$', ha='right', va='top')
ax.plot(*zip(Point(1, 2)), 'o')
plt.show()
直感に反する気もしますが,ようは文字列 $\mathrm{A}$ から見て点 $(1, 2)$ が右上にあるようにセットする,という意味だと思います(この作業は
emathでちまちま点 \put\A[s]{$1$} などとやっていたのを思い出させます).
とりあえず,全パターンに対してどういうプロットがなされるかを次で示しました.やはり点とテキストが近いです.もう少し離す方法はないのでしょうか(textの座標をちょっとずらすなどは思いつきますが,座標の目盛りなどに依存しない技が欲しいです).
from itertools import product

fig = plt.figure(figsize=(8, 8)) #画像サイズを大きめに
ax = fig.add_subplot(1, 1, 1)
ax.set_axis_off()
ax.set_aspect('equal')
ax.set_xlim(-1, 3)
ax.set_ylim(0, 13)

has = ['left', 'center', 'right']
vas = ['top', 'center', 'bottom', 'baseline']

for i, (ha, va) in enumerate(product(has, vas)):
    ax.plot(*zip([0, 12-i]), 'o')
    ax.text(0, 12-i, '$\mathrm{A}$', ha=ha, va=va)
    ax.text(.5, 12-i, "ha='{ha}', va='{va}'".format(ha=ha, va=va), va='center')

plt.savefig('hava.svg') #ブラウザ上で見にくければ,svg画像をご覧ください.
plt.show()
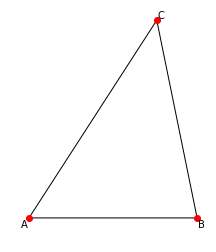
さて,本題です.一応,次のようにして三角形に頂点の名前が配置できます.
fig = plt.figure()
ax = fig.add_subplot(1, 1, 1)
ax.set_aspect('equal')
ax.set_axis_off()

ax.add_patch(plt.Polygon((A, B, C), fill=False))
ax.plot(*zip(*t.vertices), 'ro')

plt.text(*A, '$\mathrm{A}$', ha='right', va='top')
plt.text(*B, '$\mathrm{B}$', ha='left', va='top')
plt.text(*C, '$\mathrm{C}$', ha='left', va='bottom')

plt.show()
余談ですが,高校の数学では,頂点を表すアルファベットはローマン体で書くことが多いのですが,欧米だと斜体がほとんどのように思えます.頂点 $\mathrm{A}$ の角度,すなわち $\angle\mathrm{A}$を斜体の $A$ で表すので,点としての $\mathrm{A}$ と,数を表す $A$ で区別しているものと思われます.
三角形の五心を図示しよう
いよいよコアの部分に突入します.改めて,変数の設定を確認(さっきと同様です).
ABC = Triangle(sss=(5, 6, 7))
A, B, C = ABC.vertices #頂点
AB, BC, CA = Segment(A, B), Segment(B, C), Segment(C, A) #辺の設定 右辺は ABC.sidesと同等
a, b, c = BC.length, CA.length, AB.length #辺の長さ
opposides = { #頂点に対する対辺(opposite side)
    A: BC,
    B: CA,
    C: AB
}
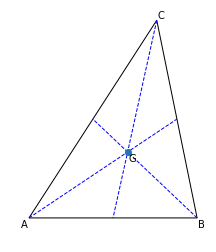
重心を図示しよう
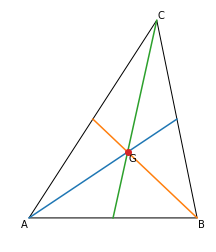
重心の定義は,中線の交点です.中線とは,頂点とその対辺の中点を結んでできる線分のことです.より具体的にいえば,$\triangle\mathrm{ABC}$ に対して,$\mathrm{A}$ と $\mathrm{BC}$ の中点を結んでできる線分は中線の一つです.Segmentにはmidpoint属性があります.その名の通り,線分の中点を表します.よってax.plot(*zip(A, BC.midpoint))で中線が引けます.
fig = plt.figure()
ax = fig.add_subplot(1, 1, 1)
ax.set_aspect('equal')
ax.set_axis_off()

ax.add_patch(plt.Polygon((A, B, C), fill=False))

G = ABC.centroid #重心を取得
ax.plot(*zip(A, BC.midpoint)) #AとBCの中点を結ぶ
ax.plot(*zip(B, CA.midpoint)) #BとCAの中点を結ぶ
ax.plot(*zip(C, AB.midpoint)) #CとABの中点を結ぶ
ax.plot(*zip(G), 'o') #重心をプロット

plt.text(*A, '$\mathrm{A}$', ha='right', va='top')
plt.text(*B, '$\mathrm{B}$', ha='left', va='top')
plt.text(*C, '$\mathrm{C}$', ha='left', va='bottom')
plt.text(*G, '$\mathrm{G}$', ha='left', va='top')

plt.show()
対辺を表すopposidesを用いるとforループで中線が引けるので,あとで一括で太さなどを変えることが簡単にできます.
fig = plt.figure()
ax = fig.add_subplot(1, 1, 1)
ax.set_aspect('equal')
ax.set_axis_off()

ax.add_patch(plt.Polygon((A, B, C), fill=False))

G = ABC.centroid #重心を取得
for X in [A, B, C]: #中線のプロット
    ax.plot(*zip(X, opposides[X].midpoint), linestyle='--', color='blue', linewidth=1)
ax.plot(*zip(G), 'o') #重心をプロット

ax.text(*A, '$\mathrm{A}$', ha='right', va='top')
ax.text(*B, '$\mathrm{B}$', ha='left', va='top')
ax.text(*C, '$\mathrm{C}$', ha='left', va='bottom')
ax.text(*G, '$\mathrm{G}$', ha='left', va='top')

plt.show()
重心の公式
ところで,重心をプロットするのに既に出来上がっているプロパティを用いましたが,高校でも習う通り,$\triangle\mathrm{ABC}$ の重心を $\mathrm{G}$ とすると
$$
\overrightarrow{\mathrm{OG}}=\frac{\overrightarrow{\mathrm{OA}}+\overrightarrow{\mathrm{OB}}+\overrightarrow{\mathrm{OC}}}{3}
$$
で表せます.また,Pointオブジェクトはベクトルのように加法や実数倍が可能ですので,G=(A+B+C)/3で重心が簡単に求まります.
ABC=Triangle(sss=(5,6,7))
A, B, C = ABC.vertices
G = (A+B+C)/3 #重心を計算
G == ABC.centroid
True
垂心を図示しよう
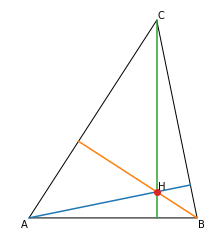
垂心の定義は,頂点から対辺(またはその延長)へ引いた垂線の交点です.この垂線のことを英語ではaltitudeというそうです(辞書には「高さ」とでます).Triangleオブジェクトには既にこれら垂線が頂点をキーとする辞書として用意されています.
alts = ABC.altitudes #垂線の取得
alts
{Point2D(0, 0): Segment2D(Point2D(0, 0), Point2D(24/5, 2*sqrt(6)/5)),
 Point2D(5, 0): Segment2D(Point2D(361/245, 228*sqrt(6)/245), Point2D(5, 0)),
 Point2D(19/5, 12*sqrt(6)/5): Segment2D(Point2D(19/5, 0), Point2D(19/5, 12*sqrt(6)/5))}
alts[A]は頂点 $\mathrm{A}$ からの垂線を表す線分が返ってくるので,さっき説明したax.plot(*zip(*alts[A].args))で垂線が図示できます.
fig = plt.figure()
ax = fig.add_subplot(1, 1, 1)
ax.set_aspect('equal')
ax.set_axis_off()
ax.add_patch(plt.Polygon((A, B, C), fill=False))

H=ABC.orthocenter #垂心の取得
alts = ABC.altitudes #垂線の取得
for X in [A, B, C]: #垂線のプロット
    ax.plot(*zip(*alts[X].args))
ax.plot(*zip(H), 'o') #垂心をプロット

plt.text(*A, '$\mathrm{A}$', ha='right', va='top')
plt.text(*B, '$\mathrm{B}$', ha='left', va='top')
plt.text(*C, '$\mathrm{C}$', ha='left', va='bottom')
plt.text(*H, '$\mathrm{H}$', ha='left', va='bottom')

plt.show()
線分ではなく直線を図示しよう
外心の図示に進む前に,直線のプロットを考えます.数学的に直線とは始点と終点が存在しない無限に伸びた線のことです.そもそもmatplotlibはヒストグラムや散布図など,有限のデータを扱うためのものだと思っているので,無限に長い直線なんてのは本来の用途とは外れる気がするのですが,今回は擬似的に,とても長い線分として直線をプロットすることにします.
直線のベクトル方程式
今したいのは,異なる2点 $\mathrm{P}, \mathrm{Q}$ が与えられたときに,線分 $\mathrm{PQ}$ を延長したとても長い線分をプロットすることです.高校で習った通り,直線 $\mathrm{PQ}$ のベクトル方程式は
$$
\overrightarrow{\mathrm{OX}} = \overrightarrow{\mathrm{OP}} + t\overrightarrow{\mathrm{PQ}} \quad(-\infty < t <\infty)
$$
です.$t$ の範囲をいじれば長さを変えることができます.例えば線分 $\mathrm{PQ}$ のベクトル方程式は
$$
\overrightarrow{\mathrm{OX}} = \overrightarrow{\mathrm{OP}} + t\overrightarrow{\mathrm{PQ}} \quad(0 \leqq t \leqq 1)
$$
です.線分 $\mathrm{PQ}$ を $\mathrm{Q}$ の方向へ$2$倍にした線分は
$$
\overrightarrow{\mathrm{OX}} = \overrightarrow{\mathrm{OP}} + t\overrightarrow{\mathrm{PQ}} \quad(0 \leqq t \leqq 2)
$$
になります.
一般に $t_m<t_M$ なる実数に対して
$$
\overrightarrow{\mathrm{OX}} = \overrightarrow{\mathrm{OP}} + t\overrightarrow{\mathrm{PQ}} \quad(t_m \leqq t \leqq t_M)
$$
と表せる線分について考えましょう.
$$
\overrightarrow{\mathrm{PQ}}=\overrightarrow{\mathrm{OQ}}-\overrightarrow{\mathrm{OP}}
$$
ですから,この線分の始点の位置ベクトルは $t=t_m$ を代入した
$$
\overrightarrow{\mathrm{OP}} + t_m(\overrightarrow{\mathrm{OQ}}-\overrightarrow{\mathrm{OP}})
$$
で,終点の位置ベクトルは $t=t_M$ を代入した
$$
\overrightarrow{\mathrm{OP}} + t_M(\overrightarrow{\mathrm{OQ}}-\overrightarrow{\mathrm{OP}})
$$
で表せます.これを python で表現すると,始点はp+(q-p)*t_m,終点はp+(q-p)*t_Mとなります.実際に
p = Point(0, 0)
q = Point(2, 1)
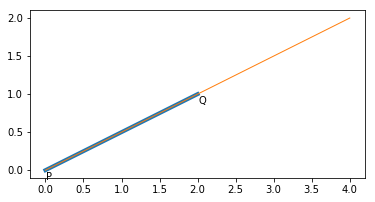
という設定で $\mathrm{PQ}$ を延長した線分をプロットしてみましょう.次は
$$
\overrightarrow{\mathrm{OX}} = \overrightarrow{\mathrm{OP}} + t\overrightarrow{\mathrm{PQ}} \quad(0 \leqq t \leqq 2)
$$
のプロット例です.
fig = plt.figure()
ax = fig.add_subplot(1, 1, 1)
ax.set_aspect('equal')

p = Point(0, 0)
q = Point(2, 1)

t_m = 0
t_M = 2

start = p+(q-p)*t_m #始点
end = p+(q-p)*t_M #終点

ax.plot(*zip(p, q), linewidth=4) #線分PQは太く
ax.plot(*zip(start, end), linewidth=1)

ax.text(*p, '$\mathrm{P}$', ha='left', va='top')
ax.text(*q, '$\mathrm{Q}$', ha='left', va='top')

plt.show()
確かに $\mathrm{PQ}$ を2倍にした線分がプロットされました.次は
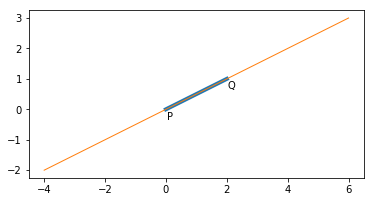
$$
\overrightarrow{\mathrm{OX}} = \overrightarrow{\mathrm{OP}} + t\overrightarrow{\mathrm{PQ}} \quad(-2 \leqq t \leqq 3)
$$
を図示してみます.
fig = plt.figure()
ax = fig.add_subplot(1, 1, 1)
ax.set_aspect('equal')

p = Point(0, 0)
q = Point(2, 1)

t_m = -2
t_M = 3

start = p+(q-p)*t_m #始点
end = p+(q-p)*t_M #終点

ax.plot(*zip(p, q), linewidth=4) #線分PQは太く
ax.plot(*zip(start, end), linewidth=1)

ax.text(*p, '$\mathrm{P}$', ha='left', va='top')
ax.text(*q, '$\mathrm{Q}$', ha='left', va='top')

plt.show()
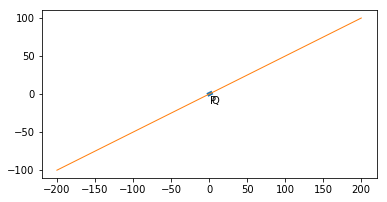
程度がよく分かりませんが,t_m=-100,t_M=100とすればほぼ無限に長い直線といえそうです.
fig = plt.figure()
ax = fig.add_subplot(1, 1, 1)
ax.set_aspect('equal')

p = Point(0, 0)
q = Point(2, 1)

t_m = -100
t_M = 100

start = p+(q-p)*t_m #始点
end = p+(q-p)*t_M #終点

ax.plot(*zip(p, q), linewidth=4) #線分PQは太く
ax.plot(*zip(start, end), linewidth=1)

ax.text(*p, '$\mathrm{P}$', ha='left', va='top')
ax.text(*q, '$\mathrm{Q}$', ha='left', va='top')

plt.show()
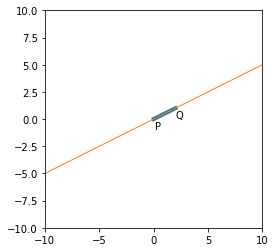
実際に使うときは,軸の範囲を狭めます.
plt.show()
fig = plt.figure()
ax = fig.add_subplot(1, 1, 1)
ax.set_aspect('equal')
ax.set_xlim(-10, 10) #xの範囲を絞る
ax.set_ylim(-10, 10) #yの範囲を絞る

p = Point(0, 0)
q = Point(2, 1)

t_m = -100
t_M = 100

start = p+(q-p)*t_m #始点
end = p+(q-p)*t_M #終点

ax.plot(*zip(p, q), linewidth=4) #線分PQは太く
ax.plot(*zip(start, end), linewidth=1)

ax.text(*p, '$\mathrm{P}$', ha='left', va='top')
ax.text(*q, '$\mathrm{Q}$', ha='left', va='top')

plt.show()
関数にして扱いやすくしましょう.
def side_of_line(p, q, mint=-100, maxt=100):
    return zip(p+(q-p)*mint, p+(q-p)*maxt)

def side_of_ray(p, q, maxt=100):
    return zip(p, p+(q-p)*maxt)
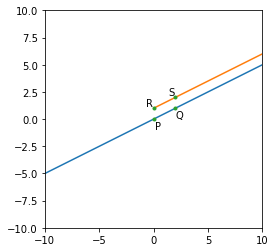
sideは端点,という意味のつもりで使ってます.ついでに半直線(片方だけ無限に長い線.英語でray)も定義しておきました.次の例は,$\mathrm{P}(0, 0), \mathrm{Q}(2, 1), \mathrm{R}(0, 1), \mathrm{S}(2, 2)$ に対して直線 $\mathrm{PQ}$ と,半直線 $\mathrm{RS}$ をプロットする例です.
fig = plt.figure()
ax = fig.add_subplot(1, 1, 1)
ax.set_aspect('equal')
ax.set_xlim(-10, 10)
ax.set_ylim(-10, 10)

p = Point(0, 0)
q = Point(2, 1)
r = Point(0, 1)
s = Point(2, 2)

ax.plot(*side_of_line(p, q))
ax.plot(*side_of_ray(r, s))

ax.text(*p, '$\mathrm{P}$', ha='left', va='top')
ax.text(*q, '$\mathrm{Q}$', ha='left', va='top')
ax.text(*r, '$\mathrm{R}$', ha='right', va='bottom')
ax.text(*s, '$\mathrm{S}$', ha='right', va='bottom')

ax.plot(*zip(p, q, r, s), '.')

plt.show()
外心と外接円を図示しよう
外心は外接円の中心といっても同じことですが,伝統的には各辺の垂直二等分線の交点です.Triangleオブジェクトには当然のことながら垂直二等分線も用意されています.線分 AB の垂直二等分線はAB.perpendicular_bisector()で得られます.これをSegmentオブジェクトと同様にしてプロットをすると一つ問題が発生します.
fig = plt.figure()
ax = fig.add_subplot(1, 1, 1)
ax.set_aspect('equal')
ax.set_axis_off()

ax.add_patch(plt.Polygon((A, B, C), fill=False))

ax.plot(*zip(*AB.perpendicular_bisector().args)) #ABの垂直二等分線をプロット?
ax.plot(*zip(*BC.perpendicular_bisector().args)) #BCの垂直二等分線をプロット?
ax.plot(*zip(*CA.perpendicular_bisector().args)) #CAの垂直二等分線をプロット?
ax.plot(*ABC.circumcenter, 'o') #外心をプロット

ax.text(*A, '$\mathrm{A}$', ha='right', va='top')
ax.text(*B, '$\mathrm{B}$', ha='left', va='top')
ax.text(*C, '$\mathrm{C}$', ha='left', va='bottom')

plt.show()
AB.perpendicular_bisector().argsによって得られる直線上の2点がどういう風に設定されているのかは不明(片方は$\mathrm{AB}$の中点)ですが,やはり短すぎです.そこで,side_of_line関数で200倍にしましょう.
fig = plt.figure()
ax = fig.add_subplot(1, 1, 1)
ax.set_aspect('equal')
ax.set_axis_off()
ax.set_xlim(-10, 10)
ax.set_ylim(-10, 10)

ax.add_patch(plt.Polygon((A, B, C), fill=False))

ax.plot(*side_of_line(*AB.perpendicular_bisector().args)) #ABの垂直二等分線をプロット
ax.plot(*side_of_line(*BC.perpendicular_bisector().args)) #BCの垂直二等分線をプロット
ax.plot(*side_of_line(*CA.perpendicular_bisector().args)) #CAの垂直二等分線をプロット

ax.plot(*ABC.circumcenter, 'o') #外心

ax.text(*A, '$\mathrm{A}$', ha='right', va='top')
ax.text(*B, '$\mathrm{B}$', ha='left', va='top')
ax.text(*C, '$\mathrm{C}$', ha='left', va='bottom')

plt.show()
うまくいきました.もう少しスリム化して,外接円などを足したものが次です.
ax = plt.gca()
ax.set_xlim((-3,8))
ax.set_ylim((-3,8))
ax.set_axis_off()
ax.set_aspect('equal')

ax.add_patch(plt.Polygon((A, B, C), fill=False))

O=ABC.circumcenter #外心の取得

for X in [A, B, C]:
    ax.plot(*side_of_line(*opposides[X].perpendicular_bisector().args)) #Xの対辺の垂直二等分線をプロット

ax.plot(*O, 'o') #外心をプロット
ax.add_patch(plt.Circle(O, ABC.circumradius, fill=False)) #外接円をプロット

ax.text(*A, '$\mathrm{A}$', ha='right', va='top')
ax.text(*B, '$\mathrm{B}$', ha='left', va='top')
ax.text(*C, '$\mathrm{C}$', ha='left', va='bottom')
ax.text(*O, '$\mathrm{O}$', ha='right', va='top')

plt.show()
内心と内接円を図示しよう
内心は内角の二等分線の交点であり,内接円の中心でもあります.ABC.bisectorsに頂点をキーとする角の二等分線を表すSegmentが入っています.
ax = plt.gca()
ax.set_axis_off()
ax.set_aspect('equal')

ax.add_patch(plt.Polygon((A, B, C), fill=False))

bisectors = ABC.bisectors() #内角の二等分線を取得

I = ABC.incenter #内心の取得
for X in [A, B, C]:
    ax.plot(*zip(*bisectors[X].args)) #角Xの二等分線をプロット
ax.plot(*zip(I), 'o') #内心をプロット
ax.add_patch(plt.Circle(I, ABC.inradius, fill=False)) #内接円をプロット

ax.text(*A, '$\mathrm{A}$', ha='right', va='top')
ax.text(*B, '$\mathrm{B}$', ha='left', va='top')
ax.text(*C, '$\mathrm{C}$', ha='left', va='bottom')
ax.text(*I, '$\mathrm{I}$', ha='left', va='top')

plt.show()
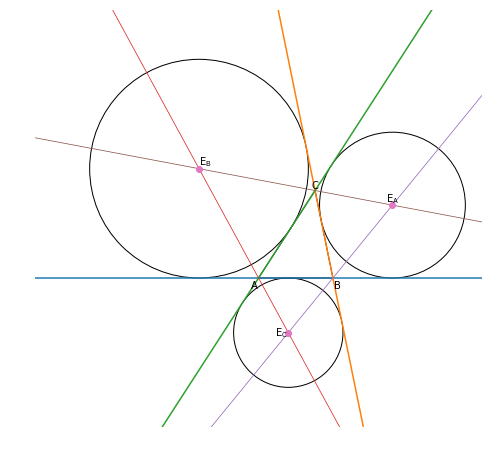
傍心と傍接円を図示しよう
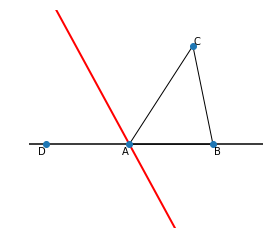
傍心は,外角の二等分線交点として定義される点で少し難しいのですが,ある意味で内心を拡張したような存在です.残念ながらTriangleにはそれらしい属性が存在しませんでした.なので自力で作るしかありません.とりあえず,次のコードは無視して出来上がった図を見てください.
ax = plt.gca()
ax.set_axis_off()
ax.set_aspect('equal')
ax.set_xlim((-6, 8))
ax.set_ylim((-5, 8))

ax.add_patch(plt.Polygon((A, B, C), fill=False))

ax.plot(*side_of_line(A, B), color='black') #ABの延長

D = A*2-B

CAD = Triangle(C, A, D) #三角形CAD

ax.plot(*side_of_line(*CAD.bisectors()[A].args), linewidth=2, color='red') #CADのAの二等分線

ax.text(*A, '$\mathrm{A}$', ha='right', va='top')
ax.text(*B, '$\mathrm{B}$', ha='left', va='top')
ax.text(*C, '$\mathrm{C}$', ha='left', va='bottom')
ax.text(*D, '$\mathrm{D}$', ha='right', va='top')

ax.plot(*zip(A,B,C,D),'o')

plt.show()
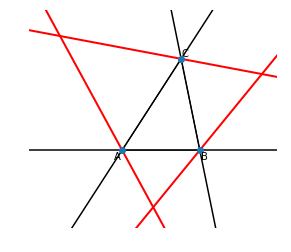
図の $\angle\mathrm{CAD}$ を $\mathrm{A}$ の外角といいます.外角の二等分線とは,図の赤色の直線です.$\mathrm{AB}=\mathrm{AD}$ となるように点 $\mathrm{D}$ をとっているので,
$$
\overrightarrow{\mathrm{OD}} = \overrightarrow{\mathrm{OA}}-\overrightarrow{\mathrm{AB}}
=\overrightarrow{\mathrm{OA}}-(\overrightarrow{\mathrm{OB}}-\overrightarrow{\mathrm{OA}})
=\overrightarrow{\mathrm{2OA}}-\overrightarrow{\mathrm{OB}}
$$
ですから
D = A*2-B
で点 $\mathrm{D}$ が作れます.そして,三角形 $\triangle\mathrm{CAD}$ の角 $\angle\mathrm{A}$ の二等分線として外角の二等分線をプロットしているのです.
全ての頂点の外角の二等分線をプロットしてみます.
ax = plt.gca()
ax.set_axis_off()
ax.set_aspect('equal')
ax.set_xlim((-6, 10))
ax.set_ylim((-5, 9))

ax.add_patch(plt.Polygon((A, B, C), fill=False))

ax.plot(*side_of_line(A, B), color='black') #ABの延長
ax.plot(*side_of_line(B, C), color='black') #BCの延長
ax.plot(*side_of_line(C, A), color='black') #CAの延長

ax.plot(*side_of_line(*Triangle(C, A, A*2-B).bisectors()[A].args), linewidth=2, color="red")
ax.plot(*side_of_line(*Triangle(A, B, B*2-C).bisectors()[B].args), linewidth=2, color="red")
ax.plot(*side_of_line(*Triangle(B, C, C*2-A).bisectors()[C].args), linewidth=2, color="red")

ax.text(*A, '$\mathrm{A}$', ha='right', va='top')
ax.text(*B, '$\mathrm{B}$', ha='left', va='top')
ax.text(*C, '$\mathrm{C}$', ha='left', va='bottom')

ax.plot(*zip(A,B,C),'o')

plt.show()
これら外角の二等分線の3つの交点が傍心です.sympyは二直線に対して交点を求める関数が用意されていますが,ここは天下り的に傍心の座標を計算します.
三角形 $\triangle\mathrm{ABC}$ を固定するとき,任意の平面上の点 $\mathrm{P}$ は $3$ つの実数 $s, t, u$ を用いて
$$
\overrightarrow{\mathrm{OP}}=\frac{s\overrightarrow{\mathrm{OA}}+t\overrightarrow{\mathrm{OB}}+u\overrightarrow{\mathrm{OC}}}{s+t+u}
$$
という形で表せることが知られています.この3つの実数の組 $(s, t, u)$ を $\mathrm{P}$ の重心座標といいます.重心 $\mathrm{G}$ の重心座標は $(1, 1, 1)$ です.実は,内心 $\mathrm{I}$ は
$$
\overrightarrow{\mathrm{OI}}=\frac{a\overrightarrow{\mathrm{OA}}+b\overrightarrow{\mathrm{OB}}+c\overrightarrow{\mathrm{OC}}}{a+b+c}
$$
で表せることが知られているので,重心座標は $(a, b, c)$ です.実は,3つの傍心の重心座標は
$$
(-a, b, c),\ (a, -b, c),\ (a, b, -c)
$$
であることが知られています.よって傍心は
$$
\frac{-a\overrightarrow{\mathrm{OA}}+b\overrightarrow{\mathrm{OB}}+c\overrightarrow{\mathrm{OC}}}{-a+b+c},\
\frac{a\overrightarrow{\mathrm{OA}}-b\overrightarrow{\mathrm{OB}}+c\overrightarrow{\mathrm{OC}}}{a-b+c},\
\frac{a\overrightarrow{\mathrm{OA}}+b\overrightarrow{\mathrm{OB}}-c\overrightarrow{\mathrm{OC}}}{a+b-c}
$$
で計算できます.そして,傍心を中心とし各辺の延長に接する円,傍接円というものがあり,それらの半径は
$$
\frac{2S}{-a+b+c},\ \frac{2S}{a-b+c},\ \frac{2S}{a+b-c}
$$
で与えられます.ここで $S$ は $\triangle\mathrm{ABC}$ の面積です.これらを総括してプロットしたものの例が次です.
fig = plt.figure(figsize=(8, 8))
ax = fig.add_subplot(1, 1, 1)
ax.set_axis_off()
ax.set_aspect('equal')
ax.set_xlim((-15, 15))
ax.set_ylim((-10, 18))

ax.add_patch(plt.Polygon((A, B, C), fill=False))

for seg in [AB, BC, CA]: #線分の延長
    ax.plot(*side_of_line(*seg.args))

ax.plot(*side_of_line(*Triangle(B, A, A*2-C).bisectors()[A].args), linewidth=.75)
ax.plot(*side_of_line(*Triangle(C, B, B*2-A).bisectors()[B].args), linewidth=.75) #外角の二等分線
ax.plot(*side_of_line(*Triangle(A, C, C*2-B).bisectors()[C].args), linewidth=.75)

excenters = { #傍心
    A: (-A*a+B*b+C*c)/(-a+b+c),
    B: (A*a-B*b+C*c)/(a-b+c),
    C: (A*a+B*b-C*c)/(a+b-c)
}

exradiuses = { #傍接円の半径 ABC.areaはABCの面積
    A: 2*ABC.area/(-a+b+c),
    B: 2*ABC.area/(a-b+c),
    C: 2*ABC.area/(a+b-c)
}

ax.plot(*zip(*excenters.values()), 'o') #傍心のプロット

for X in [A, B, C]: #傍接円のプロット
    ax.add_patch(plt.Circle(excenters[X], exradiuses[X], fill=False))

ax.text(*A, '$\mathrm{A}$', ha='right', va='top')
ax.text(*B, '$\mathrm{B}$', ha='left', va='top')
ax.text(*C, '$\mathrm{C}$', ha='center', va='bottom')
ax.text(*excenters[A], '$\mathrm{E_A}$', ha='center', va='bottom')
ax.text(*excenters[B], '$\mathrm{E_B}$', ha='left', va='bottom')
ax.text(*excenters[C], '$\mathrm{E_C}$', ha='right', va='center')

plt.show()
オイラー線
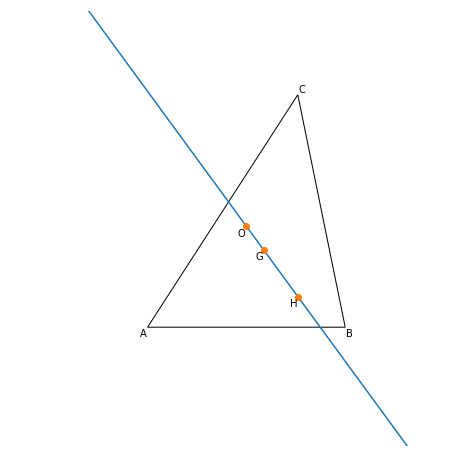
重心と外心と垂心は同一直線上に乗っかっていることが知られています.この直線をオイラー線といいます.確認してみましょう.
fig = plt.figure(figsize=(8, 8))
ax = fig.add_subplot(1, 1, 1)
ax.set_axis_off()
ax.set_aspect('equal')
ax.set_xlim((-3,8))
ax.set_ylim((-3,8))

ax.add_patch(plt.Polygon((A, B, C), fill=False))

G=ABC.centroid #重心の取得
O=ABC.circumcenter #外心の取得
H=ABC.orthocenter #垂心の取得

ax.plot(*side_of_line(O, H)) #オイラー線のプロット
ax.plot(*zip(G, O, H), 'o') #3点のプロット

ax.text(*A, '$\mathrm{A}$', ha='right', va='top')
ax.text(*B, '$\mathrm{B}$', ha='left', va='top')
ax.text(*C, '$\mathrm{C}$', ha='left', va='bottom')
ax.text(*G, '$\mathrm{G}$', ha='right', va='top')
ax.text(*O, '$\mathrm{O}$', ha='right', va='top')
ax.text(*H, '$\mathrm{H}$', ha='right', va='top')

plt.show()
ちなみに,$\mathrm{OG}: \mathrm{GH} = 1:2$ であることが知られています.
$$
\overrightarrow{\mathrm{OH}} = \overrightarrow{\mathrm{OA}}+\overrightarrow{\mathrm{OB}}+\overrightarrow{\mathrm{OC}}
$$
であることを示せば重心の公式より
$$
\overrightarrow{\mathrm{OG}} = \frac{\overrightarrow{\mathrm{OA}}+\overrightarrow{\mathrm{OB}}+\overrightarrow{\mathrm{OC}}}{3}
$$
であることより直ちに証明できます.
九点円を図示しよう
いよいよ九点円に入ります.
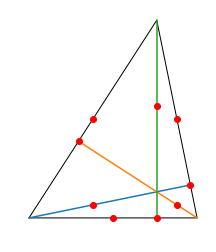
どの九点?
三角形 $\triangle\mathrm{ABC}$ において,
- 各辺の中点
- 頂点から対辺に引いた垂線の足
- 垂心と頂点の中点
計9つをプロットしましょう.
fig = plt.figure()
ax = fig.add_subplot(1, 1, 1)
ax.set_aspect('equal')
ax.set_axis_off()

H = ABC.orthocenter #垂心を取得
alts = ABC.altitudes #垂線を取得

nine_points = []

for X in [A, B, C]:
    nine_points.append(opposides[X].midpoint) #対辺の中点
    if X == alts[X].p1: #線分alts[X] の始点alts[X].p1, 終点alts[X].p2のうち,頂点でない方が垂線の足
        nine_points.append(alts[X].p2)
    else:
        nine_points.append(alts[X].p1)
    nine_points.append(Segment(X, H).midpoint) #垂心と頂点の中点

ax.add_patch(plt.Polygon((A, B, C), fill=False))

for X in [A, B, C]:
    ax.plot(*zip(*alts[X].args))
ax.plot(*zip(*nine_points), 'ro')

plt.show()
確かにこの九つの点は同一の円上にありそうです.なんと九点円は初めからTriagnleオブジェクトに入っています.
npc = ABC.nine_point_circle #ABCの九点円
print(npc.center, npc.radius) #九点円の中心と半径
Point2D(63/20, 163*sqrt(6)/240) 35*sqrt(6)/48
fig = plt.figure()
ax = fig.add_subplot(1, 1, 1)
ax.set_aspect('equal')
ax.set_axis_off()

H = ABC.orthocenter #垂心を取得
alts = ABC.altitudes #垂線を取得

nine_points = []

for X in [A, B, C]:
    nine_points.append(opposides[X].midpoint) #対辺の中点
    if X == alts[X].p1: #線分alts[X] の始点alts[X].p1, 終点alts[X].p2のうち,頂点でない方が垂線の足
        nine_points.append(alts[X].p2)
    else:
        nine_points.append(alts[X].p1)
    nine_points.append(Segment(X, H).midpoint) #垂心と頂点の中点

ax.add_patch(plt.Polygon((A, B, C), fill=False))

for X in [A, B, C]:
    ax.plot(*zip(*alts[X].args))
ax.plot(*zip(*nine_points), 'ro')

npc = ABC.nine_point_circle #九点円を取得
ax.add_patch(plt.Circle(npc.center, npc.radius, fill=False, linewidth=1)) #九点円をプロット
ax.plot(*zip(npc.center), 'o', color = 'purple') #九点円の中心をプロット

plt.show()
九点円の中心とオイラー線
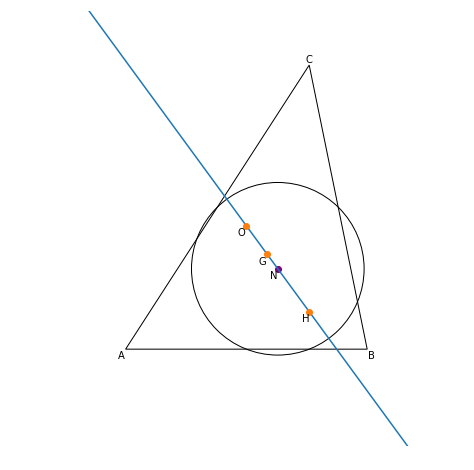
九点円の中心は外心と垂心の中点であることが知られています.ということは,九点円の中心と重心,外心,垂心の4点はオイラー上にあることが分かります.
fig = plt.figure(figsize=(8, 8))
ax = fig.add_subplot(1, 1, 1)
ax.set_xlim((-2,7))
ax.set_ylim((-2,7))
ax.set_aspect('equal')
ax.set_axis_off()

ax.add_patch(plt.Polygon((A, B, C), fill=False))

npc = ABC.nine_point_circle #九点円を取得
ax.add_patch(plt.Circle(npc.center, npc.radius, fill=False, linewidth=1)) #九点円をプロット
ax.plot(*zip(npc.center), 'o', color = 'purple') #九点円の中心をプロット

G = ABC.centroid #重心の取得
O = ABC.circumcenter #外心の取得
H = ABC.orthocenter #垂心の取得

ax.plot(*side_of_line(O, H)) #オイラー線のプロット
ax.plot(*zip(G, O, H), 'o') #3点のプロット

ax.text(*A, '$\mathrm{A}$', ha='right', va='top')
ax.text(*B, '$\mathrm{B}$', ha='left', va='top')
ax.text(*C, '$\mathrm{C}$', ha='center', va='bottom')
ax.text(*G, '$\mathrm{G}$', ha='right', va='top')
ax.text(*O, '$\mathrm{O}$', ha='right', va='top')
ax.text(*H, '$\mathrm{H}$', ha='right', va='top')
ax.text(*npc.center, '$\mathrm{N}$', ha='right', va='top')

plt.show()
フォイエルバッハの定理
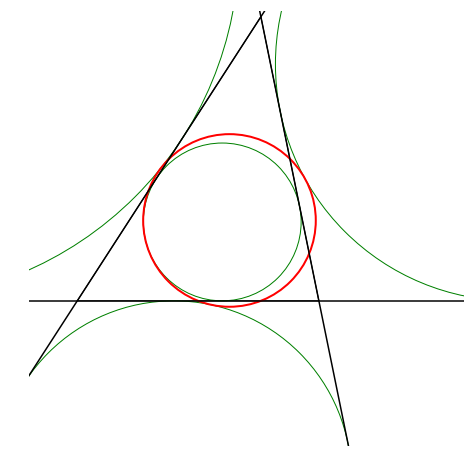
九点円は内接円に内接し,傍接円に外接しています.
fig = plt.figure(figsize=(8, 8))
ax = fig.add_subplot(1, 1, 1)
ax.set_aspect('equal')
ax.set_axis_off()
ax.set_xlim((-1, 8))
ax.set_ylim((-3, 6))

ax.add_patch(plt.Polygon((A, B, C), fill=False))
for seg in [AB, BC, CA]: #線分の延長
    ax.plot(*side_of_line(*seg.args), color='black')

npc = ABC.nine_point_circle #ABCの九点円

I = ABC.incenter

excenters = { #傍心
    A: (-A*a+B*b+C*c)/(-a+b+c),
    B: (A*a-B*b+C*c)/(a-b+c),
    C: (A*a+B*b-C*c)/(a+b-c)
}

exradiuses = { #傍接円の半径 ABC.areaはABCの面積
    A: 2*ABC.area/(-a+b+c),
    B: 2*ABC.area/(a-b+c),
    C: 2*ABC.area/(a+b-c)
}

ax.add_patch(plt.Circle(I, ABC.inradius, fill=False, linewidth=1, color='green')) #内接円のプロット

for X in [A, B, C]: #傍接円のプロット
    ax.add_patch(plt.Circle(excenters[X], exradiuses[X], fill=False, linewidth=1, color='green'))

ax.add_patch(plt.Circle(npc.center, npc.radius, fill=False, linewidth=2, color="red"))

plt.show()
確かに九点円(赤)は,内接円と傍接円と接しています.
まとめると九点円は
- 中心が重心,外心,垂心と直線で結ばれている
- 内心,傍心を中心とする内接円,傍接円に接している.
ということが分かり,三角形の五心である,重心,外心,垂心,内心,傍心と関係を持っていることが分かりました.
最後に全部詰め込もう
from sympy.geometry import Point, Circle, Triangle, Segment, Line
import numpy as np
import matplotlib.pyplot as plt

def side_of_line(p, q, mint=-100, maxt=100):
    return zip(p+(q-p)*mint, p+(q-p)*maxt)

ABC = Triangle(sss=(5, 6, 7))
A, B, C = ABC.vertices #頂点
AB, BC, CA = Segment(A, B), Segment(B, C), Segment(C, A) #辺の設定 右辺は ABC.sidesと同等
a, b, c = BC.length, CA.length, AB.length #辺の長さ
opposides = {A: BC, B: CA, C: AB} #頂点に対する対辺(opposite side)

fig = plt.figure(figsize=(10, 10))
ax = fig.add_subplot(1, 1, 1)
ax.set_aspect('equal')
ax.set_axis_off()
ax.set_xlim((-10, 14))
ax.set_ylim((-8, 16))

npc = ABC.nine_point_circle #ABCの九点円を取得
N = npc.center #九点円の中心を取得
G = ABC.centroid #重心の取得
O = ABC.circumcenter #外心の取得
H = ABC.orthocenter #垂心の取得
I = ABC.incenter #内心の取得

excenters = { #傍心を計算
    A: (-A*a+B*b+C*c)/(-a+b+c),
    B: (A*a-B*b+C*c)/(a-b+c),
    C: (A*a+B*b-C*c)/(a+b-c)
}

exradiuses = { #傍接円の半径 ABC.areaはABCの面積
    A: 2*ABC.area/(-a+b+c),
    B: 2*ABC.area/(a-b+c),
    C: 2*ABC.area/(a+b-c)
}

alts = ABC.altitudes #垂線を取得

nine_points = [] #九点
for X in [A, B, C]:
    nine_points.append(opposides[X].midpoint) #対辺の中点
    if X == alts[X].p1: #線分alts[X] の始点alts[X].p1, 終点alts[X].p2のうち,頂点でない方が垂線の足
        nine_points.append(alts[X].p2)
    else:
        nine_points.append(alts[X].p1)
    nine_points.append(Segment(X, H).midpoint) #垂心と頂点の中点
ax.add_patch(plt.Polygon((A, B, C), facecolor='#67BE91', alpha=.3)) #三角形ABCをプロット
for seg in ABC.sides:
    ax.plot(*side_of_line(*seg.args), color='#422500', linewidth=.3) #辺の延長をプロット

for X in [A, B, C]:
    seg = opposides[X] #Xの対辺
    ax.plot(*zip(*alts[X].args), color='#00612E', linewidth=.2) #垂線をプロット
    ax.plot(*side_of_line(*seg.perpendicular_bisector().args), '--', color='gray', linewidth=.3) #垂直二等分線をプロット
    ax.plot(*zip(X, seg.midpoint), color='#00612E', linewidth=.2) #中線をプロット
    ax.plot(*zip(*ABC.bisectors()[X].args), '--', color='gray', linewidth=.3) #角Xの二等分線

ax.plot(*side_of_line(*Triangle(B, A, A*2-C).bisectors()[A].args),'--',  color='gray', linewidth=.3)
ax.plot(*side_of_line(*Triangle(C, B, B*2-A).bisectors()[B].args),'--',  color='gray', linewidth=.3) #外角の二等分線
ax.plot(*side_of_line(*Triangle(A, C, C*2-B).bisectors()[C].args),'--',  color='gray', linewidth=.3)

ax.plot(*side_of_line(O, H), '-', linewidth=5, color='#EC6800', alpha=.4)#オイラー線をプロット

ax.add_patch(plt.Circle(I, ABC.inradius, linestyle='--', edgecolor='#9D221B', fill=False, linewidth=.3, alpha=1)) #内接円をプロット
ax.add_patch(plt.Circle(I, ABC.inradius, facecolor='gray', linewidth=0, alpha=.2)) #内接円の内部を塗り潰す

for X in [A, B, C]: #傍接円をプロット
    ax.add_patch(plt.Circle(excenters[X], exradiuses[X], edgecolor='gray', facecolor='#8BA55D', linewidth=0, alpha=.3))

ax.add_patch(plt.Circle(N, npc.radius, edgecolor='#EC6800', linewidth=.4, fill=False)) #九点円をプロット
ax.add_patch(plt.Circle(N, npc.radius, linewidth=0, facecolor='#64954F',fill=True, alpha=.3)) #九点円の内部を塗りつぶす

ax.add_patch(plt.Circle(O, ABC.circumradius, linestyle='--', edgecolor='gray', fill=False, linewidth=.3)) #外接円をプロット

ax.add_patch(plt.Polygon(tuple(excenters.values()), facecolor='#C3D300', alpha=.1)) #傍心を頂点とする三角形を塗り潰し

ax.plot(*zip(G, O, H, N), '.', color='#EF3706', ms=3) #重心,外心,垂心,九点円の中心をプロット
ax.plot(*zip(A, B, C), '.', color='black', ms=3, alpha=.5) #頂点をプロット
ax.plot(*zip(*excenters.values()), '.', color='#074d59', alpha=.5, ms=3) #傍心のプロット
ax.plot(*zip(ABC.incenter), '.', color='#074d59', alpha=.5, ms=3) #内心のプロット
ax.plot(*zip(*nine_points), '.', color='#5E4500', ms=2, alpha=.5) #九点をプロット

plt.savefig('npc.png', dpi=100)
plt.savefig('npc.svg')
plt.show()
Triangleを拡張したクラスを作りたい
Triangleに用意されていない傍心の座標などをプロパティとしてもつTriangleを継承したクラスを作りたいと思うのですが,どうも,私の生半可な知識ではうまくいきません.
from sympy.geometry import Triangle

class MyTriangle(Triangle):
    @property
    def nine_point_center(self):
        return self.nine_point_circle.center
プロパティを追加するだけなら,これで大丈夫かと思ったのですが,
a, b, c = (0, 0), (2, 0), (1, 1)
t1 = MyTriangle(a, b, c)
print(t1.nine_point_center)
Point2D(1, 1/2)
はうまくいくのですが,
t2 = MyTriangle(sss=(5, 6, 7))
print(t2.nine_point_center)
---------------------------------------------------------------------------

AttributeError                            Traceback (most recent call last)

<ipython-input-65-1d4a6d686027> in <module>()
      1 t2 = MyTriangle(sss=(5, 6, 7))
----> 2 print(t2.nine_point_center)


AttributeError: 'Triangle' object has no attribute 'nine_point_center'
だとうまくいきません.t2はTriangleオブジェクトとして認識されているようです.__new__()なども色々試してみましたがうまくいきませんでした.もし解決策をご存知の方がいらっしゃったらご教示お願いします.
