使用データ
国土数値情報「行政区域データ」を使用.今回はその中でも,広島県のshapefileを使用(仮にshapefile.shpと名付けます).
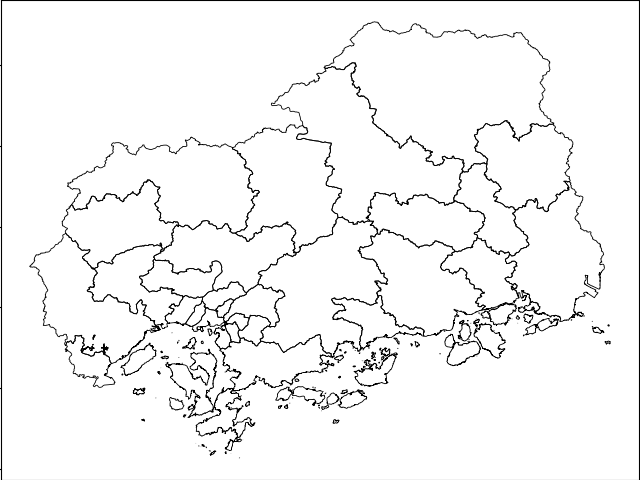
全ポリゴンの描画
広島県全体の行政区分を描画.
広島市内は区で分けられます.
import matplotlib.pyplot as plt
import geopandas as gpd

fig = plt.figure()
ax  = fig.add_subplot()

src = gpd.read_file('shapefile.shp',encoding='SHIFT-JIS')
src.plot(ax=ax, color='none', edgecolor='k', linewidth=0.6)
plt.show()
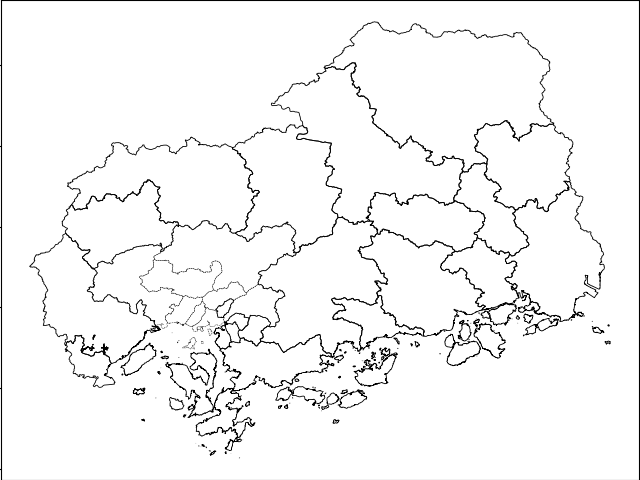
フィルタリングして描画
広島市を目立たせるために,まず区の境界線を編集します.
リストに含まれるitemに当てはまるものを,isinメソッドを用いて抽出.逆に,リストに含まれるもののみを除きたい場合は,条件文の頭に~をつける.今回は,市町村コード(pidとします)を用いてフィルタリングします.
pids = ('34101','34102','34103','34104','34105','34106','34107','34108',)

excl = src[~src['pid'].isin(pids)]
excl.plot(ax=ax, color='none', edgecolor='k', linewidth=0.6)

filt = src[ src['pid'].isin(pids)]
filt.plot(ax=ax, color='none', edgecolor='k', linestyle='--', linewidth=0.3)
plt.show()
フィルタリングしたものをマージして描画
広島市を区でわかれていない形で目立たせます.
geopandasのデータフレームから,shapely.geometry形式のポリゴンのリストを取得.これを,同系モジュールのcascaded_union()関数で結合.
from shapely.ops import cascaded_union

bound = gpd.GeoSeries(cascaded_union(filt.geometry))
bound.plot(ax=ax, color='none', edgecolor='r', linewidth=1)
plt.show()
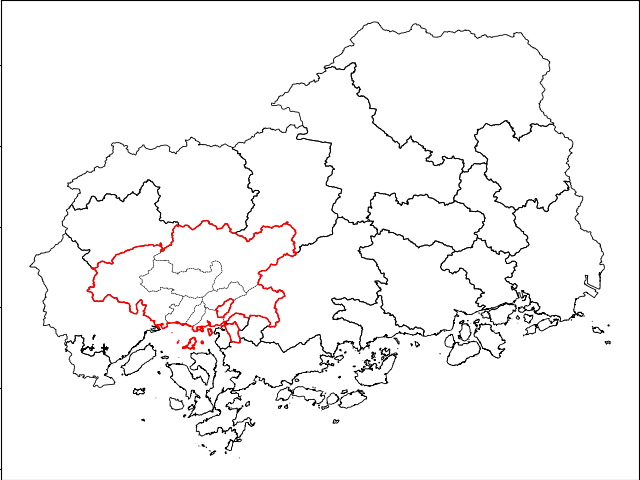
広島市に囲まれる府中町も目立っていますが,これで目標達成です.
追記
geopandasにdissolveというメソッドがあるのを発見.
こちらの方が,geometry以外のデータを処理できたりと便利そうです.
Aggregation with dissolve