InfluxDB のダッシュボードをいくつか動かしてみたので、簡単にメモしておきます
OS は Ubuntu 14.04 x86_64
InfluxDB の準備
InfluxDB - Open Source Time Series, Metrics, and Analytics Database
インストール
$ curl -LO http://s3.amazonaws.com/influxdb/influxdb_latest_amd64.deb
$ sudo dpkg -i influxdb_latest_amd64.deb
設定
- 設定ファイル: /opt/influxdb/shared/config.toml
今回は、Graphite フォーマットでデータを受信させるため、Graphite のプラグインを有効にしておきます
--- /opt/influxdb/shared/config.toml.bak	2014-10-12 02:52:28.992938615 +0000
+++ /opt/influxdb/shared/config.toml	2014-10-12 02:53:06.544940216 +0000
@@ -40,9 +40,9 @@

   # Configure the graphite api
   [input_plugins.graphite]
-  enabled = false
-  # port = 2003
-  # database = ""  # store graphite data in this database
+  enabled = true
+  port = 2003
+  database = "graphite"  # store graphite data in this database
   # udp_enabled = true # enable udp interface on the same port as the tcp interface

   # Configure the udp api
起動
$ sudo service influxdb start
データベースの作成
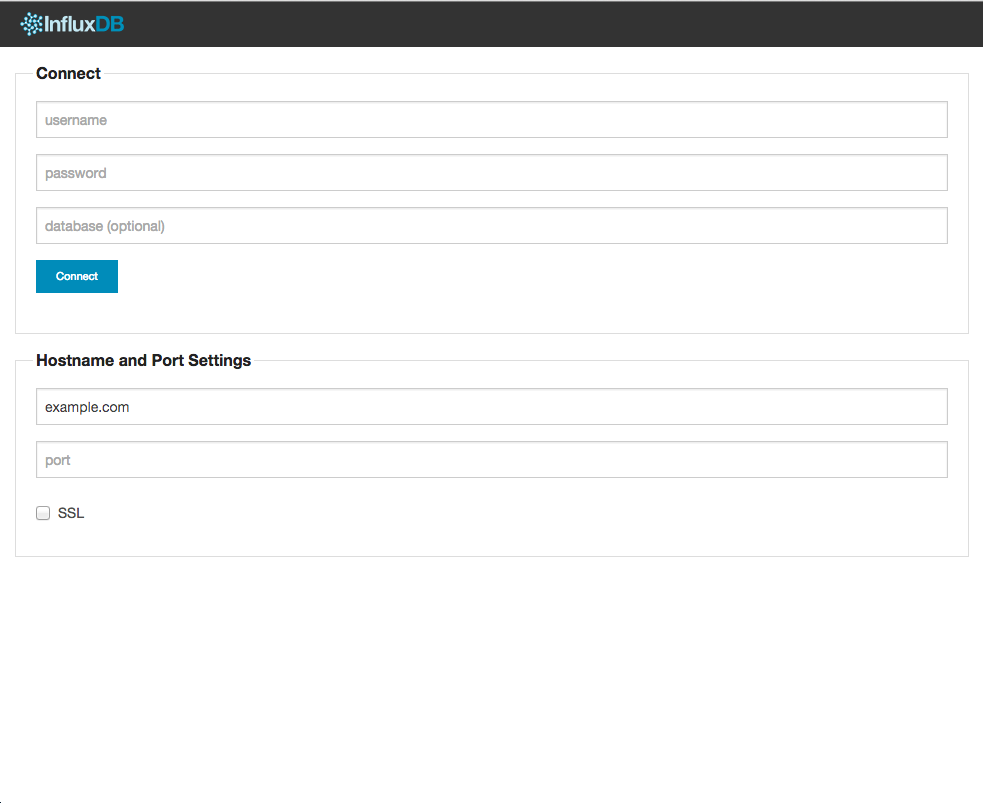
ブラウザから http://example.com:8083/ にアクセスして作成します
- Connect
- username: root
- password: root
- Hostname and Port Settings(HTTP API の hostname と port を指定します)
- hostname: example.com
- port: 8086
graphite データベースの作成
- Create a Database
- Database Name に
graphiteを入力し、Create Database を押下して、データベースを作成します
- Database Name に
- ユーザの作成
- 作成したデータベースの一覧が表示されるので、Name の
graphiteのリンクをクリックして graphite データベースのユーザを作成します - Username: admin
- Password: password
- 作成したデータベースの一覧が表示されるので、Name の
grafana データベースの作成(ダッシュボード用)
- Create a Database
- Database Name に
grafanaを入力し、Create Database を押下して、データベースを作成します
- Database Name に
- ユーザの作成
- 作成したデータベースの一覧が表示されるので、Name の
grafanaのリンクをクリックして graphite データベースのユーザを作成します - Username: admin
- Password: password
- 作成したデータベースの一覧が表示されるので、Name の
データの保存
Diamond を使用して InfluxDB にメトリクスを保存します
保存したメトリクスの確認
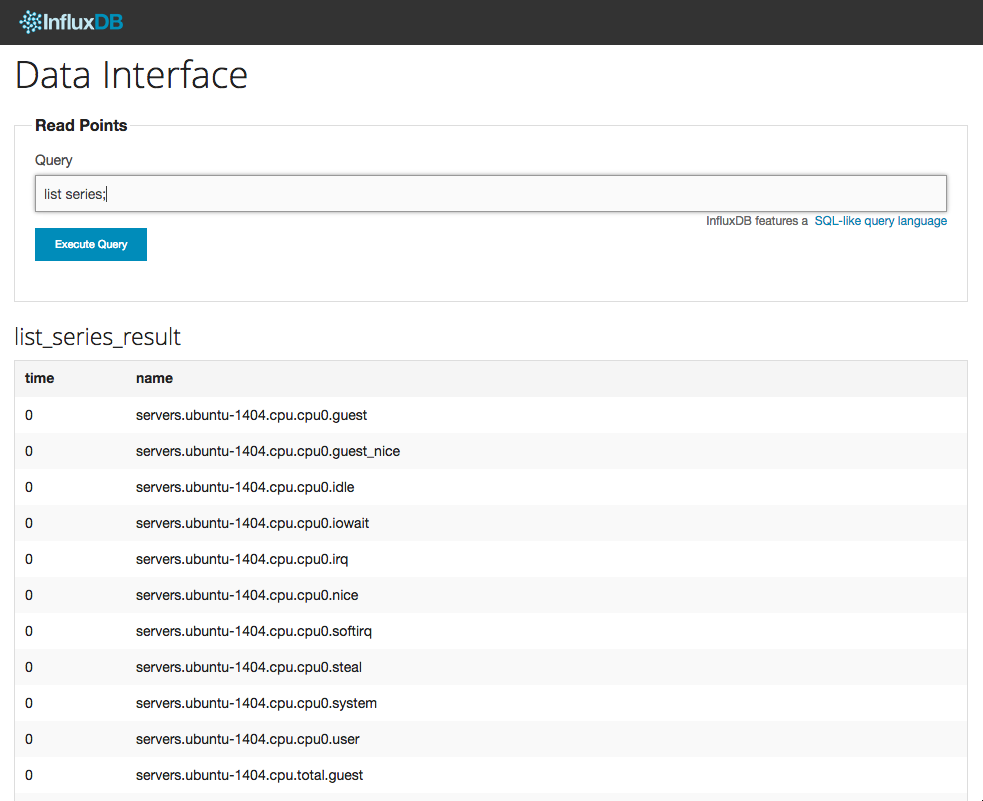
http://example.com:8083/ にアクセスして graphite データベースに接続します
Query に list series を入力して実行すると下記のように、graphite データベースに保存されているメトリクスが表示されます
Grafana
Grafana - Graphite and InfluxDB Dashboard and graph composer
インストール
Web サーバを立ち上げておき、DocumentRoot に grafana.tar.gz を展開します
$ cd $DocumentRoot
$ curl -LO http://grafanarel.s3.amazonaws.com/grafana-1.8.1.tar.gz
$ tar zxvf http://grafanarel.s3.amazonaws.com/grafana-1.8.1.tar.gz
設定
- datasources の influxdb の設定には上記で設定した graphite データベースに合わせて設定を記載します
- datasources の grafana にはダッシュボードの設定を保存するデータベースに合わせて設定を記載します
設定は config.js に記載します
$ cd grafana-1.8.1
$ cp config.sample.js config.js
--- config.sample.js	2014-09-30 16:42:49.000000000 +0000
+++ config.js	2014-10-12 02:59:07.784955615 +0000
@@ -36,6 +36,22 @@
     },
     */

+    datasources: {
+      influxdb: {
+        type: 'influxdb',
+        url: "http://example.com:8086/db/graphite",
+        username: 'admin',
+        password: 'password',
+      },
+      grafana: {
+        type: 'influxdb',
+        url: "http://example.com:8086/db/grafana",
+        username: 'admin',
+        password: 'password',
+        grafanaDB: true
+      },
+    },
+
     // Graphite & Elasticsearch example setup
     /*
     datasources: {
グラフの表示
-
http://example.com/grafana-1.8.1 にアクセスします
-
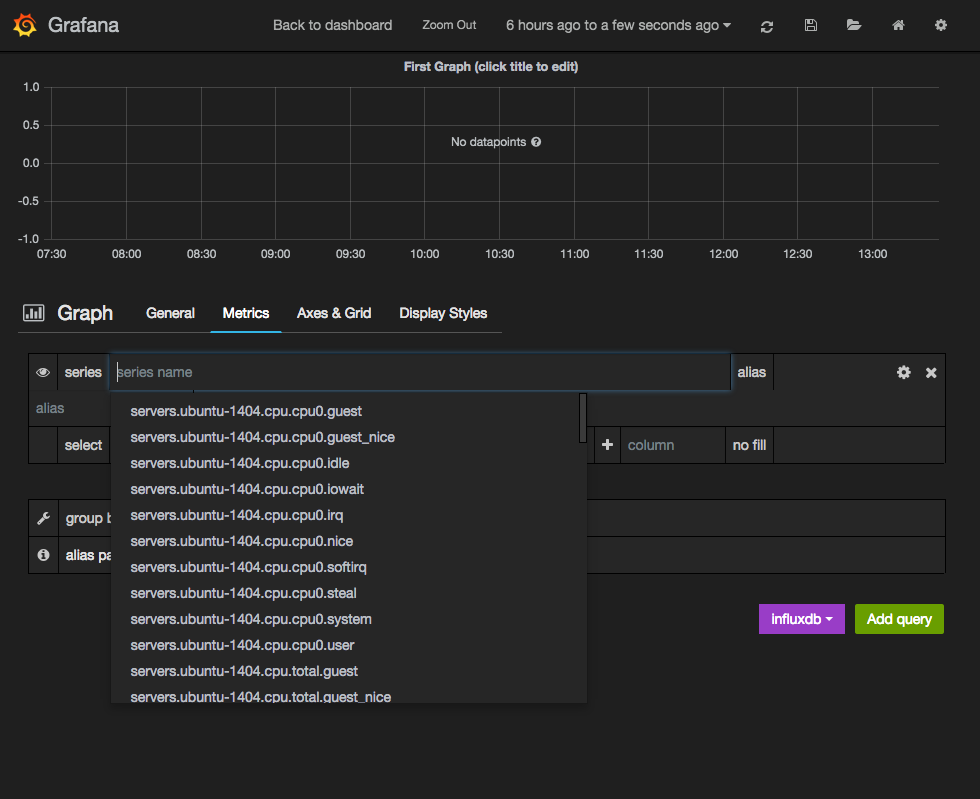
First Graph (click title to edit)を押下して、Edit を選択します - Metrics の
series nameを選択すると、InfluxDB に保存されているメトリクスが表示されるので、グラフに表示させたいメトリクスを選択します
-
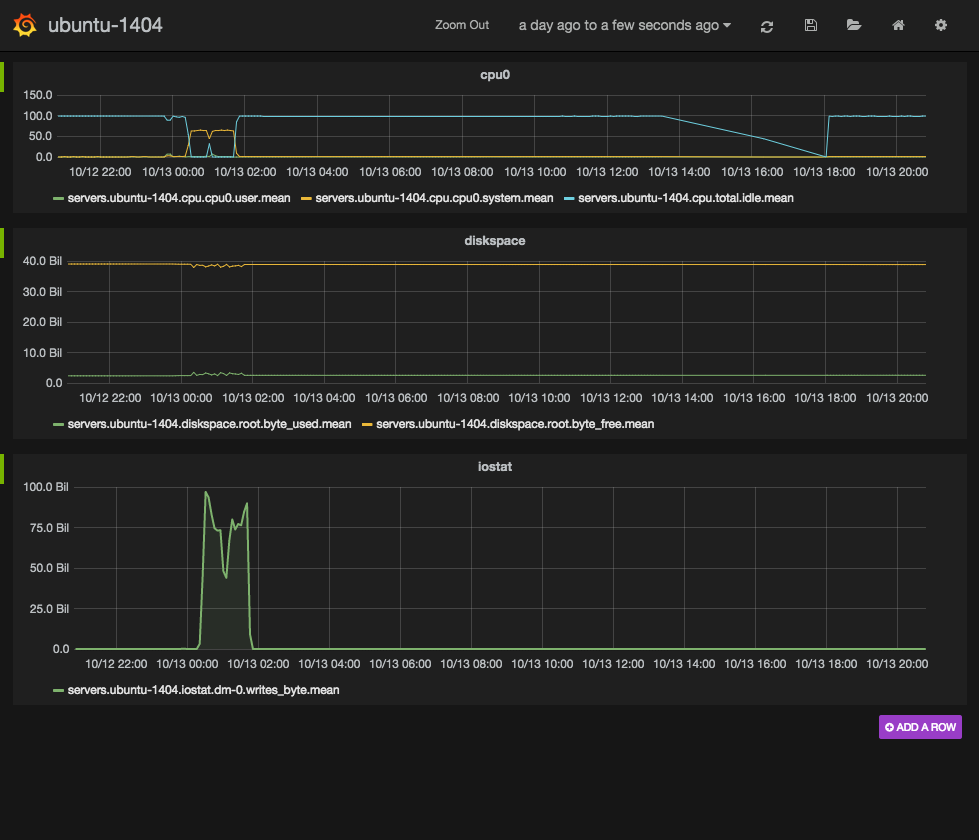
1 つのグラフ上に複数のクエリの結果を載せることもできます
Influga
インストール
$ npm install -g influga
設定
設定ファイルのテンプレートを作成します
$ influga init
Config file template is created to influga-config.json
Edit config for your environment

{
  "dashboardDbPath": "./db/influga.db",
  "host": "localhost",
  "port": 8086,
  "database": "db",
  "username": "root",
  "password": "root"
}
InfluxDB の設定内容に合わせて influga-config.json を変更します
--- influga-config.json.bak	2014-10-12 03:35:48.739833258 +0000
+++ influga-config.json	2014-10-12 03:36:59.947836293 +0000
@@ -1,8 +1,8 @@
 {
   "dashboardDbPath": "./db/influga.db",
-  "host": "localhost",
+  "host": "example.com",
   "port": 8086,
-  "database": "db",
-  "username": "root",
-  "password": "root"
-}
\ No newline at end of file
+  "database": "graphite",
+  "username": "admin",
+  "password": "password"
+}
起動
$ influga -c influga-config.json start
グラフの表示
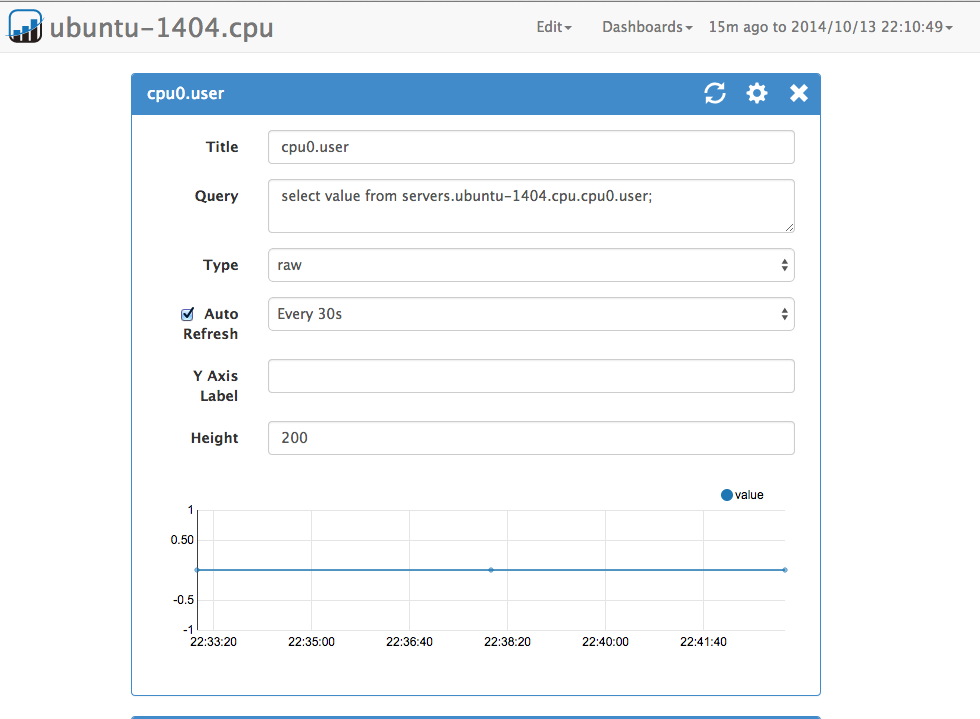
ブラウザから example.com:8089 にアクセスして、Query 等を設定します
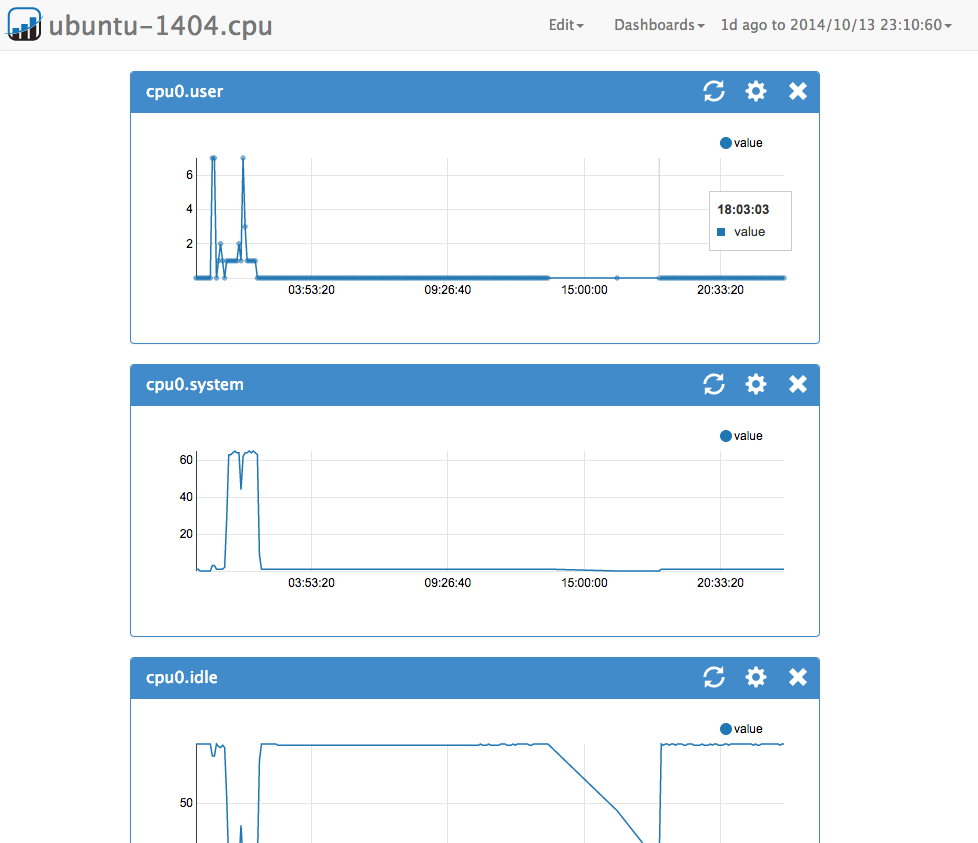
設定した後のグラフの表示
Tasseo
インストール
$ git clone https://github.com/obfuscurity/tasseo
$ cd tasseo
$ bundle install
設定
ダッシュボードに表示するメトリクスは、dashboards/ 以下の .js ファイルに設定します
$ cat <<EOT>dashboards/ubuntu-14-04-cpu0.js
var period = 1;
var metrics =
[
  {
    alias: "servers.ubuntu-1404.cpu.cpu0.user",
    target: "value",
    series: "servers.ubuntu-1404.cpu.cpu0.user",
    unit: "%",
    warning: 30,
    critical: 60
  },
  {
    alias: "servers.ubuntu-1404.cpu.cpu0.system",
    target: "value",
    series: "servers.ubuntu-1404.cpu.cpu0.system",
    unit: "%",
    warning: 30,
    critical: 60
  },
  {
    alias: "servers.ubuntu-1404.cpu.cpu0.idle",
    target: "value",
    series: "servers.ubuntu-1404.cpu.cpu0.idle",
    unit: "%"
  },
];
EOT

$ cat <<EOT>dashboards/ubuntu-14-04-cpu1.js
var period = 1;
var metrics =
[
  {
    alias: "servers.ubuntu-1404.cpu.cpu1.user",
    target: "value",
    series: "servers.ubuntu-1404.cpu.cpu1.user",
    unit: "%",
    warning: 30,
    critical: 60
  },
  {
    alias: "servers.ubuntu-1404.cpu.cpu1.system",
    target: "value",
    series: "servers.ubuntu-1404.cpu.cpu1.system",
    unit: "%",
    warning: 30,
    critical: 60
  },
  {
    alias: "servers.ubuntu-1404.cpu.cpu1.idle",
    target: "value",
    series: "servers.ubuntu-1404.cpu.cpu1.idle",
    unit: "%"
  },
];
EOT
起動
$ foreman start
グラフの表示
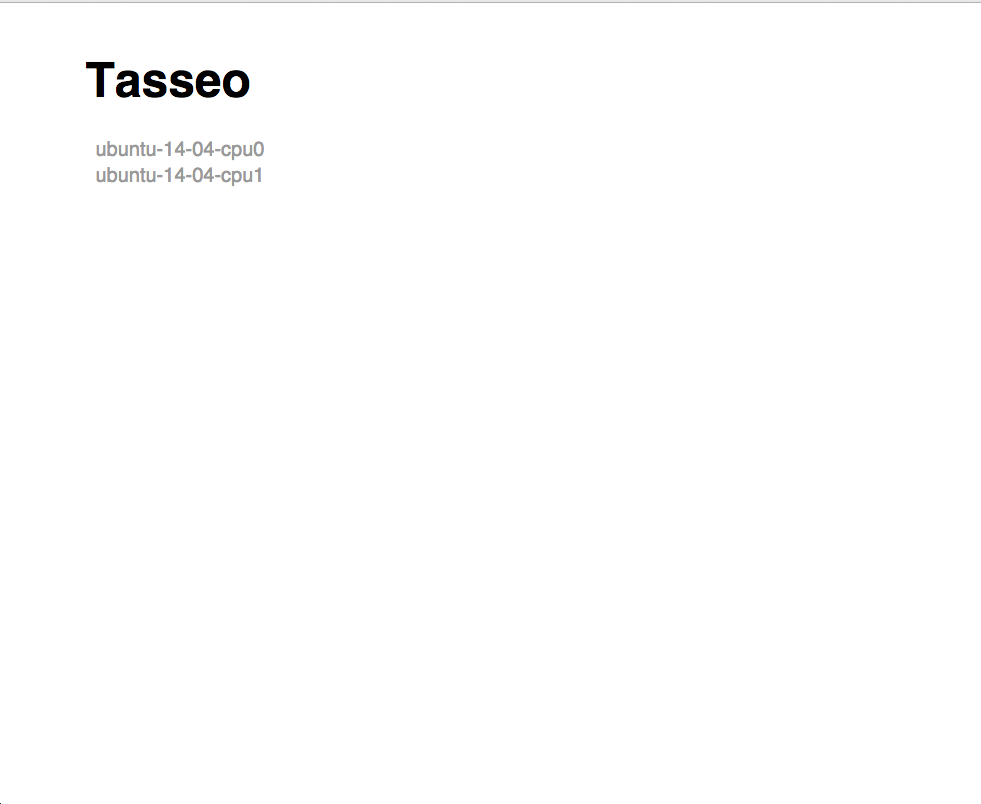
http://example.com:5000/ にアクセスしすると、dashboards/ 以下に作成した js ファイルの名前のリンクが表示されます
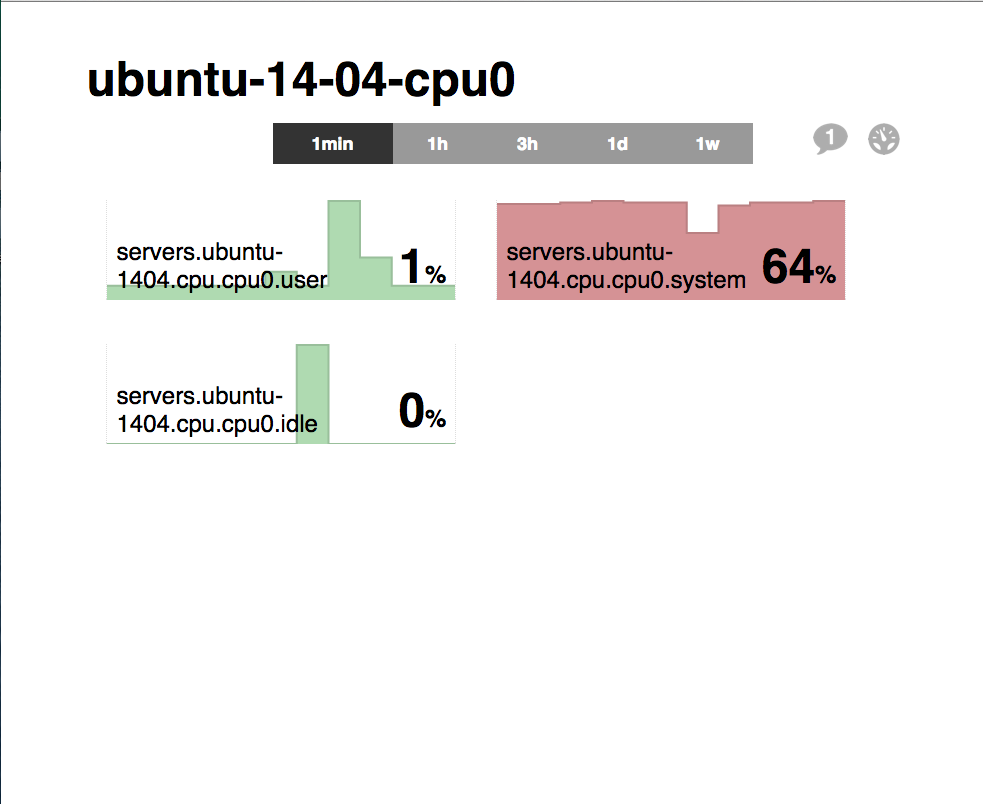
リンクを押下すると、各グラフが表示されます
js ファイルに設定した warning や critical の値を超えるとグラフの色が変わります
