Table of contents
はじめに
MATLABで行うFFT ~ 時系列データ生成から片側スペクトルの正規化まで ~ では長々とFFTをかけてパワースペクトル最大振幅を求めて図示していました。
それがなんと1行でできちゃうんです!
それもめっちゃいいかんじに…
今回はそんな神関数 pspectrum を使って正弦波のパワースペクトルを解析します。
前準備
まずは信号を作りましょう。
時間等の設定をおこないます。
dt = 0.001;
L  = 5000;
t = 0:dt:dt*(L-1);
Fs = 1/dt;
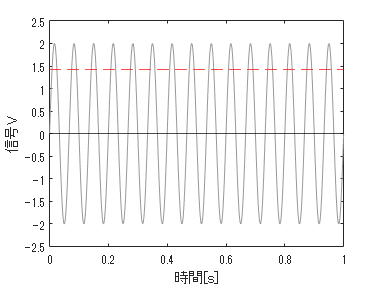
15Hzの振幅2の正弦波です。実効値は$V_{rms} =\frac{V_{max}}{\sqrt{2}}$です。
f1 = 15;
x = 2*sin(2*pi*f1*t);
図示します。
figure
plot(t,x,'Color',[.6 .6 .6])
hold on
yline(max(x)./sqrt(2),'--r');
yline(0,'k');
ylim([-1 1].*2.5)
xlim([0 1])
xlabel '時間[s]'
ylabel '信号V'
hold off
パワースペクトル解析&図示
ここからは一瞬です。
[p,f] = pspectrum(x,Fs);
ここで出力される p はパワースペクトルです。
時系列信号を $x(t)$ として、その周波数表現を $X(f)$ とすると、パワースペクトル$P(f)$ は以下のようになります。
$P(f) = X(f)^2$
振幅の実効値の二乗ですね。
$f$ は片側スペクトルになってます。
つまり、もう計算おしまいです。
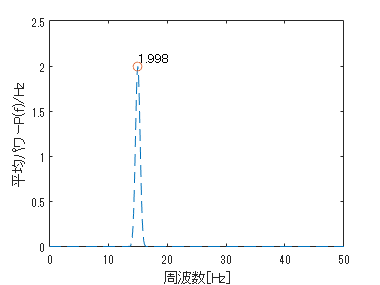
それでは図示しましょう。
figure
plot(f,p,'--');
xlabel '周波数[Hz]'
ylabel '平均パワーP(f)/Hz'
ylim([0 2.5])
hold on
idx = knnsearch(f,f1);
scatter(f(idx),p(idx),'o')
name = round(p(idx),3);
text(f(idx),p(idx)+0.1,cellstr(num2str(name)));
xlim([0 50])
hold off
リークなども補正されており、かなりいい感じになっています。
おわりに
実はこの関数、オーバーラップ量や窓の調整、stftまでできてしまいます。や、やりたかったことが…すべて…
ただ位相は見ることができないので、そこは自分で作らなければいけないかも知れないですね。
位相は こちら に書かれています。
おまけ:記事作成について
今回はTable of Contents の追加:Live Script から Markdown への自動変換 を参考に作成しました。
非常に助かっております。


