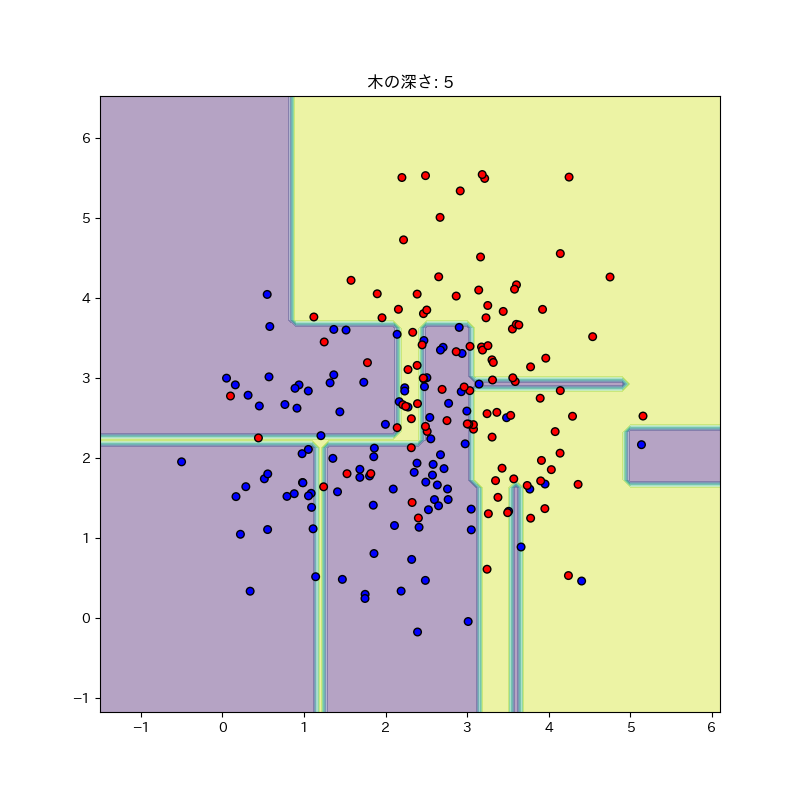
決定木がどんな感じで分類するのか確認してみる。
import matplotlib.pyplot as plt
import numpy as np
from sklearn.tree import DecisionTreeClassifier

np.random.seed(20180426)  # 乱数の出方を固定

X = np.array([[i, j] for i, j in zip(np.random.normal(2, 1, 100), np.random.normal(2, 1, 100))])
y = np.array([0] * 100)

X = np.append(X, np.array([[i, j] for i, j in zip(np.random.normal(3, 1, 100), np.random.normal(3, 1, 100))]), axis=0)
y = np.append(y, [1] * 100)


def draw_tree(n):
    clf = DecisionTreeClassifier(max_depth=n)

    clf.fit(X, y)

    x_min, x_max = X[:, 0].min() - 1, X[:, 0].max() + 1
    y_min, y_max = X[:, 1].min() - 1, X[:, 1].max() + 1
    xx, yy = np.meshgrid(np.arange(x_min, x_max, 0.1),
                         np.arange(y_min, y_max, 0.1))
    color_set = ['b' if i == 0 else 'r' for i in y]

    plt.figure(figsize=(8, 8))

    Z = clf.predict(np.c_[xx.ravel(), yy.ravel()])
    Z = Z.reshape(xx.shape)

    plt.contourf(xx, yy, Z, alpha=0.4)
    plt.scatter(X[:, 0], X[:, 1], c=color_set, s=30, edgecolor='k')
    plt.title("木の深さ: " + str(n))

    # plt.savefig("graph" + str(n) + ".png")
    plt.show()


for i in range(1, 11):
    draw_tree(i)
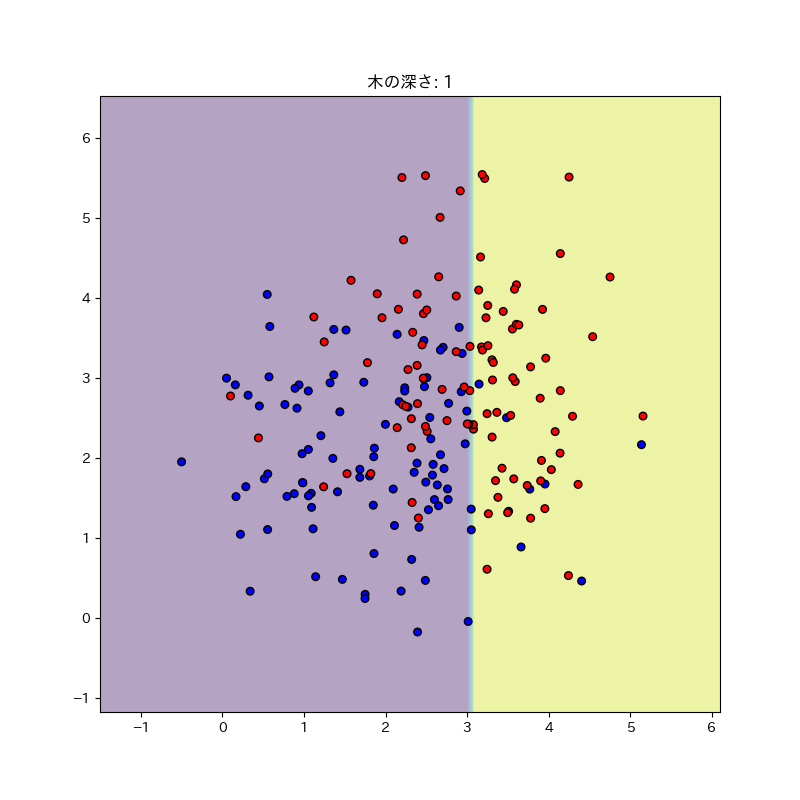
まだアバウト。
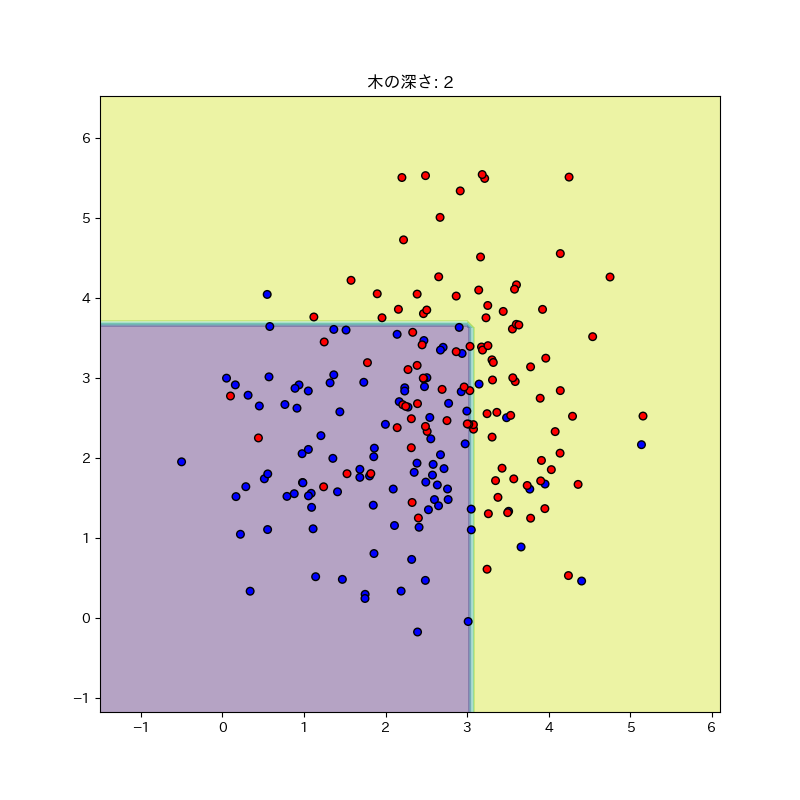
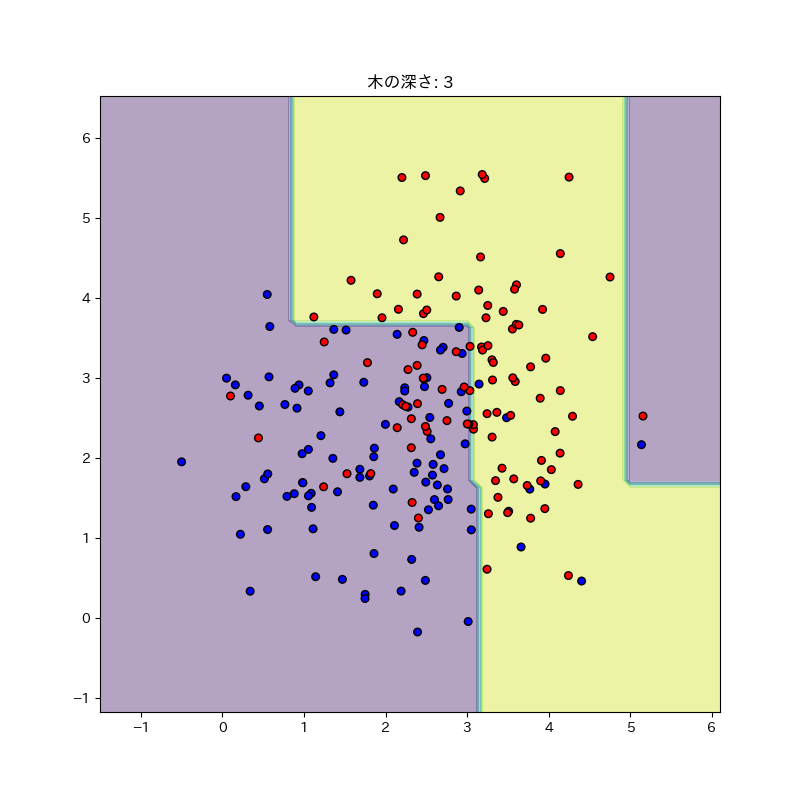
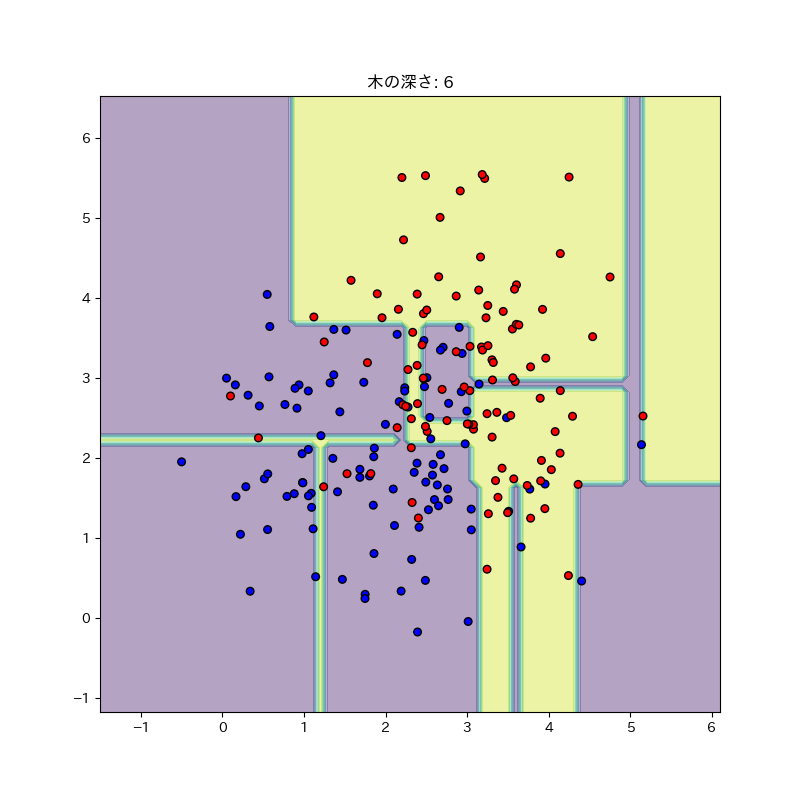
だいぶ良くなってきたか?
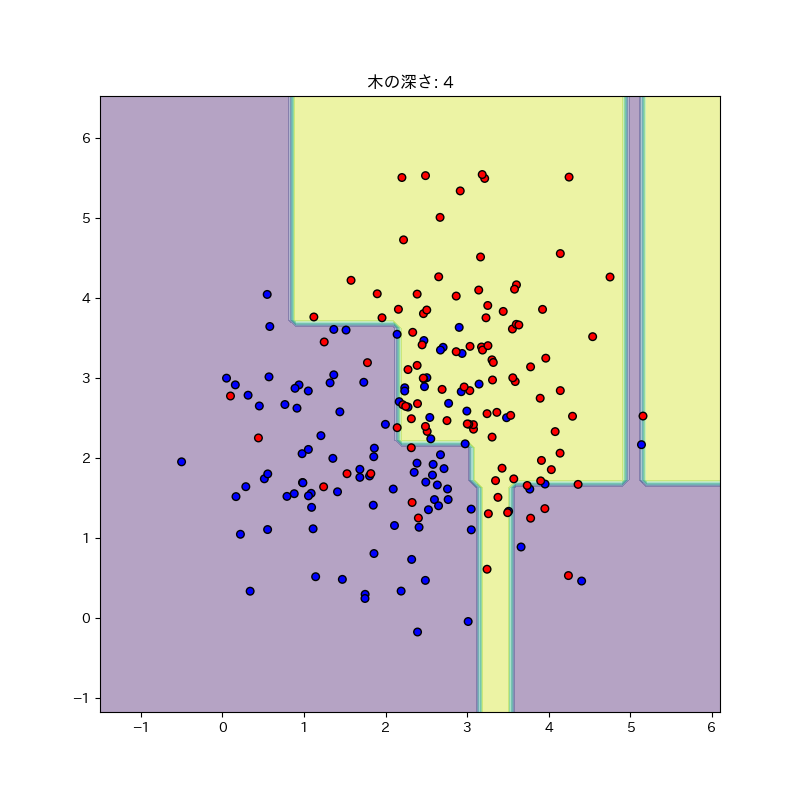
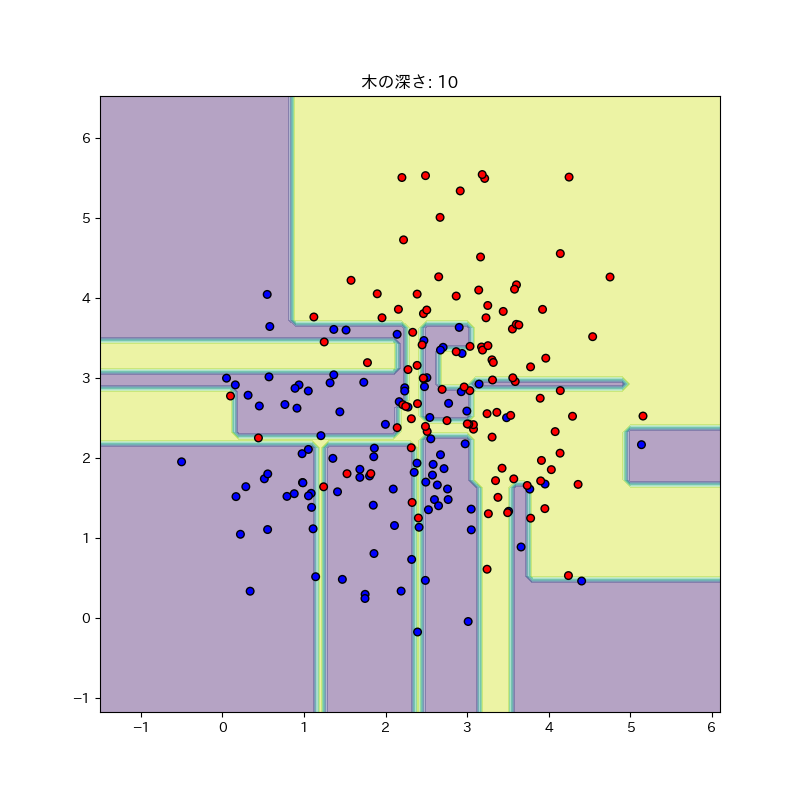
流石に過学習している感ある。最終的にはこうなった。
交差検証でスコアがどれくらいになるのか見てみよう。
import matplotlib.pyplot as plt
import numpy as np
from sklearn.tree import DecisionTreeClassifier
from sklearn.model_selection import cross_val_score

np.random.seed(20180426)  # 乱数の出方を固定

X = np.array([[i, j] for i, j in zip(np.random.normal(2, 1, 100), np.random.normal(2, 1, 100))])
y = np.array([0] * 100)

X = np.append(X, np.array([[i, j] for i, j in zip(np.random.normal(3, 1, 100), np.random.normal(3, 1, 100))]), axis=0)
y = np.append(y, [1] * 100)


def calculate_score(n):
    clf = DecisionTreeClassifier(max_depth=n)

    clf.fit(X, y)

    scores = cross_val_score(clf, X, y, cv=5)
    return np.average(scores)


xx = [i for i in range(1, 11)]
yy = [calculate_score(i) for i in range(1, 11)]

plt.xlabel("木の深さ")
plt.ylabel("スコア")
plt.xticks(np.arange(0, 11, 1))
plt.plot(xx, yy)
# plt.savefig("result.png")
plt.show()
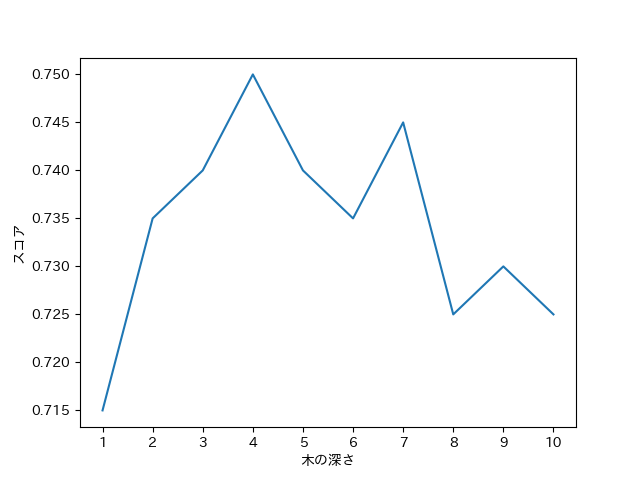
やっぱり深さ4くらいが一番マシだった。