研究室に当然のことながら、後輩がやってきました。。。そうなると、R暦1年半の私でも後輩に指導しなくてはいけません。そこでRのお勉強として、『Rではじめるデータサイエンス』を読みましょうということになりました。
プログラミングに精通する方々が使っているQiitaを利用して、情報共有をしていこうと思います。この記事に関連する情報やコードの改善点など、コメント頂けると幸いです![]()
第一回
1. ggplot2によるデータ可視化
1.1. 練習問題(p.6)
### p.6 練習問題 ###

# パッケージの読み込み
library(tidyverse)

### 1 ###
ggplot(data = mpg)
# geom_functionを指定していないため、描画デバイスが表示されるだけ

### 2 ###
dim(mtcars) # dim関数で行数と列数の確認
# >[1] 32 11

### 3 ###
?mpg
# drv  f = front-wheel drive, r = rear wheel drive, 4 = 4wd
# fは前輪駆動、rは後輪駆動、4は四輪駆動車を示す

### 4 ###
ggplot(data = mpg) +
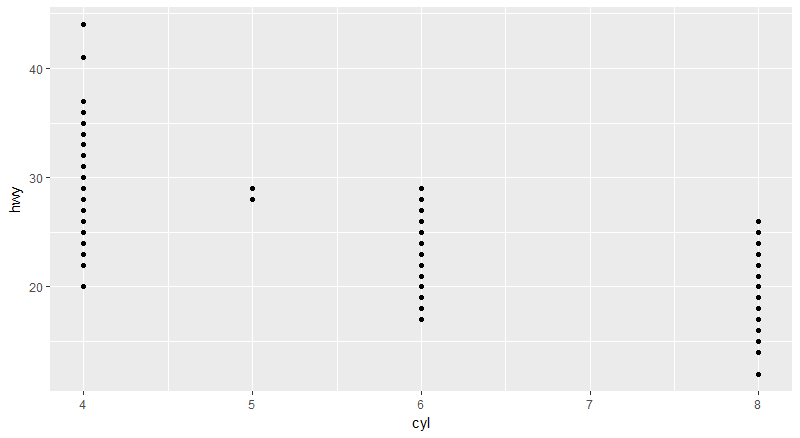
  geom_point(mapping = aes(x=cyl, y=hwy))
# シリンダーの個数に対するガロンあたりのマイルの散布図

### 5 ###
ggplot(data = mpg) +
  geom_point(mapping = aes(x=class, y=drv))
# 2種類とも非定量変数であるので、相関関係が分からない
1. ggplot(data=mpg)を実行しなさい。どうなるか。
geom_function()を指定していないので、描画デバイスだけが表示されます。

2. mtcarsには何行あるか。何列あるか。
dim関数を使えば、行数と列数が一度に得られます。上記のコードから、行数が32,列数が11ということが分かりました。
3. drv変数は何を記述するか。?mpgのヘルプを読んで見つけなさい。
せっかくなので、全ての変数の情報を確認しておきます。
| 変数名 | 英文 | 日本語訳 |
|---|---|---|
| manufacturer | manufacturer | 生産メーカー |
| model | model name | 車名 |
| displ | engine displacement, in litres | エンジン排気量、リットル |
| year | year of manufacture | 生産年 |
| cyl | number of cylinders | シリンダー数 |
| trans | type of transmission | トランスミッションタイプ |
| drv | f = front-wheel drive, r = rear wheel drive, 4 = 4wd | fが前輪、rが後輪、4が四駆 |
| cty | city miles per gallon | 1ガロンあたりのシティマイル |
| hwy | highway miles per gallon | 1ガロンあたりのハイウェイマイル |
| fl | fuel type | 燃料タイプ |
| class | "type" of car | 車種 |
4. hwyとcylの散布図を作りなさい。
5. class対drvの散布図はどうなるか。なぜプロットが役に立たないのか。
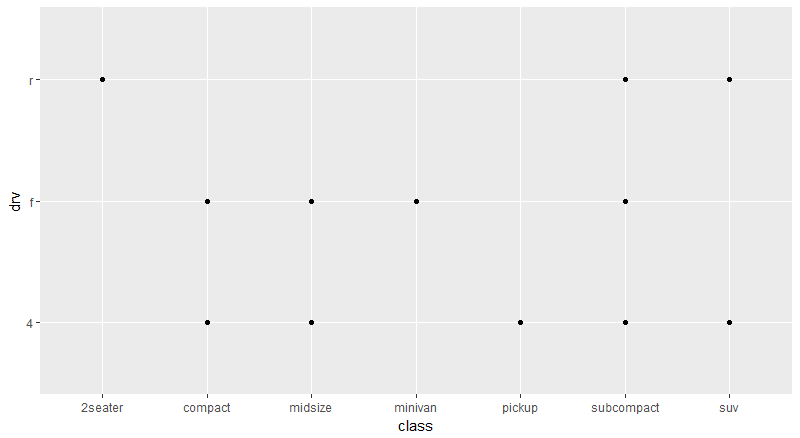
対になる変数が両者ともカテゴリ変数なので、相関が意味を持ちません。
1.2 練習問題(p.11)
### p.11 練習問題 ###

### 1 ###
# 修正前
ggplot(data = mpg) +
  geom_point(
    mapping = aes(x=displ, y=hwy, color="blue")
  )
# 修正後
ggplot(data = mpg) +
  geom_point(
    mapping = aes(x=displ, y=hwy, shape=class), color="blue"
  )
### 2 ###
# manufacturer カテゴリ変数
# model カテゴリ変数
# displ 連続変数
# year カテゴリ変数
# cyl カテゴリ変数
# trans カテゴリ変数
# drv カテゴリ変数
# cty 連続変数
# hwy 連続変数
# fl カテゴリ変数
# class カテゴリ変数

mpg
'# A tibble: 234 x 11
manufacturer model      displ  year   cyl trans      drv     cty   hwy fl    class
<chr>        <chr>      <dbl> <int> <int> <chr>      <chr> <int> <int> <chr> <chr>
  1 audi         a4          1.80  1999     4 auto(l5)   f        18    29 p     compact
2 audi         a4          1.80  1999     4 manual(m5) f        21    29 p     compact
3 audi         a4          2.00  2008     4 manual(m6) f        20    31 p     compact
4 audi         a4          2.00  2008     4 auto(av)   f        21    30 p     compact
5 audi         a4          2.80  1999     6 auto(l5)   f        16    26 p     compact
6 audi         a4          2.80  1999     6 manual(m5) f        18    26 p     compact
7 audi         a4          3.10  2008     6 auto(av)   f        18    27 p     compact
8 audi         a4 quattro  1.80  1999     4 manual(m5) 4        18    26 p     compact
9 audi         a4 quattro  1.80  1999     4 auto(l5)   4        16    25 p     compact
10 audi         a4 quattro  2.00  2008     4 manual(m6) 4        20    28 p     compact
# ... with 224 more rows'

### 3 ###
# color
ggplot(data = mpg) +
  geom_point(
    mapping = aes(x=displ, y=hwy, color=hwy)
  )
# > 色がグラデーションで表される

# size
ggplot(data = mpg) +
  geom_point(
    mapping = aes(x=displ, y=hwy, size=hwy)
  )
# > sizeが段階で変化する

# shape
ggplot(data = mpg) +
  geom_point(
    mapping = aes(x=displ, y=hwy, shape=hwy)
  )
# > Error: A continuous variable can not be mapped to shape

### 4 ###
ggplot(data = mpg) +
  geom_point(mapping = aes(x=displ, y=displ))
# 相関係数が1となるので、直線上に点が散布される

### 5 ###
# stroke=1
ggplot(data = mpg) +
  geom_point(
    mapping = aes(x=displ, y=hwy), shape=1, stroke=1
  )

# stroke=5
ggplot(data = mpg) +
  geom_point(
    mapping = aes(x=displ, y=hwy), shape=1, stroke=5
  )

### 6 ###
ggplot(data = mpg) +
  geom_point(
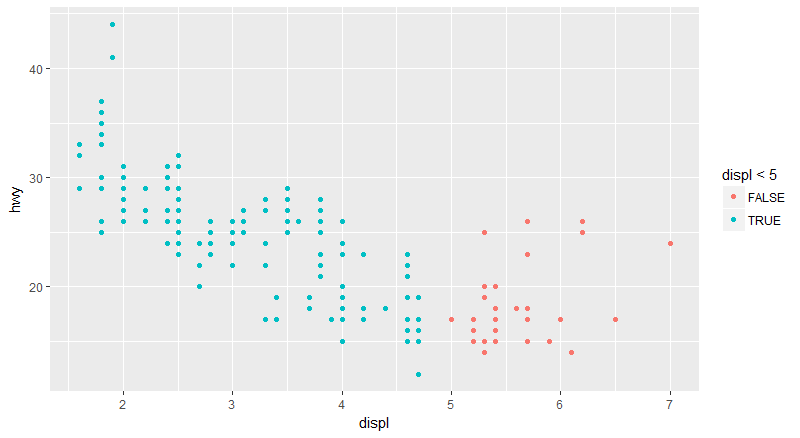
    mapping = aes(x=displ, y=hwy, color=displ<5)
  )
# TrueとFalseの領域で色が分けられる
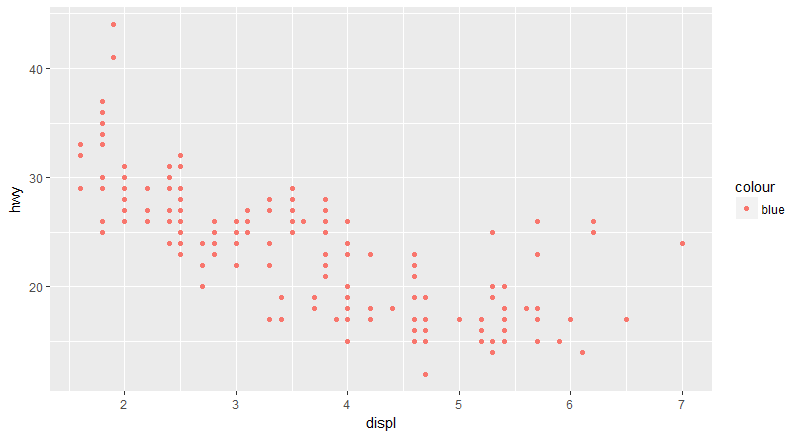
1. 次のコードはどこがおかしいか。なぜ点が青になっていないのだろうか。
修正前
修正後
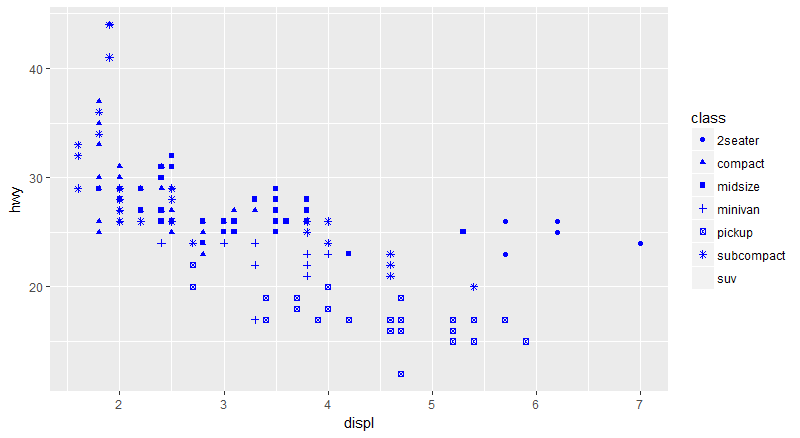
color="blue"はaes()の外に出さなければなりません。
2. mpgのどれがカテゴリ変数か。どれが連続変数か(ヒント:?mpgと入力してデータセットのドキュメントを読む)。mpgを実行したとき、この情報がどのようにして得られるか。
カテゴリ変数と連続変数についてはこちらをどうぞ。これから、連続変数がdispl,cty,hwyと分かります。
3. 連続変数をcolor,size,shapeにマップしてみる。カテゴリ変数と連続変数とでこれらのエステティック属性がどう振る舞いを変えるか。
color
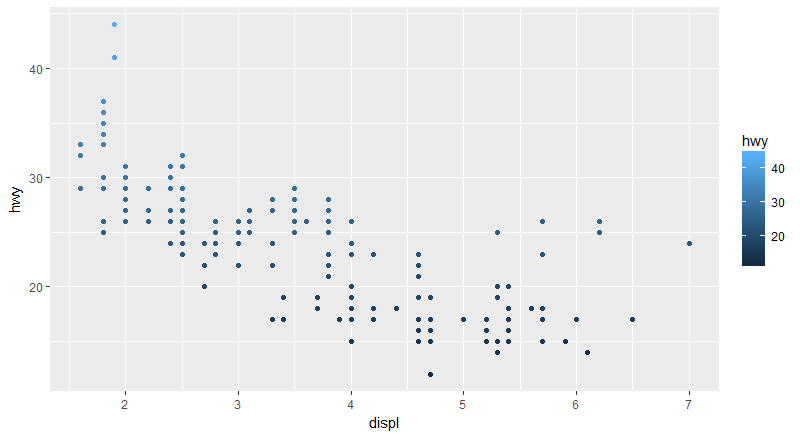
凡例がグラデーションで表されます。
size
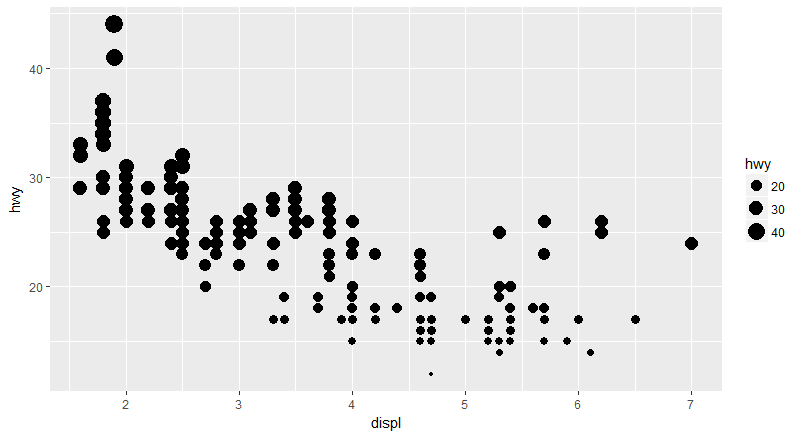
hwyの値が大きいほど、点が大きくなります。
shape
Error: A continuous variable can not be mapped to shape
のようにエラーが吐き出されます。
4. 1つの変数に複数のエステティック属性をマップするとどうなるか。
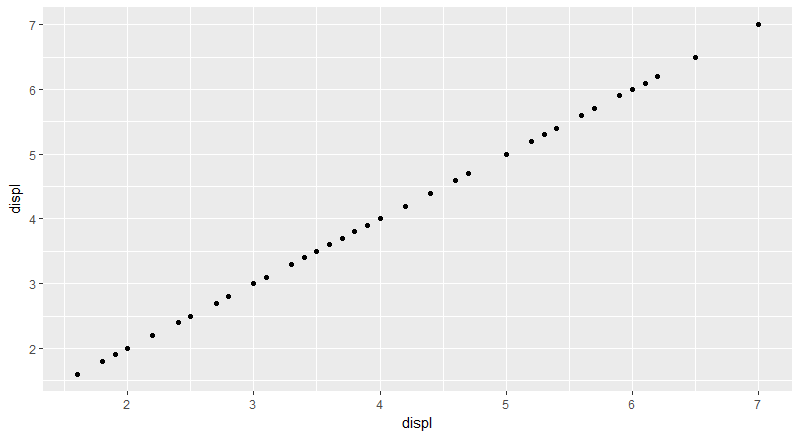
問題文の意味がピンとこなかったのですが、こういうことではないかと思われます。
5. エステティック属性strokeは何をするか。どんな形に作用するか。(ヒント:?geom_pointを使う)。
stroke=1
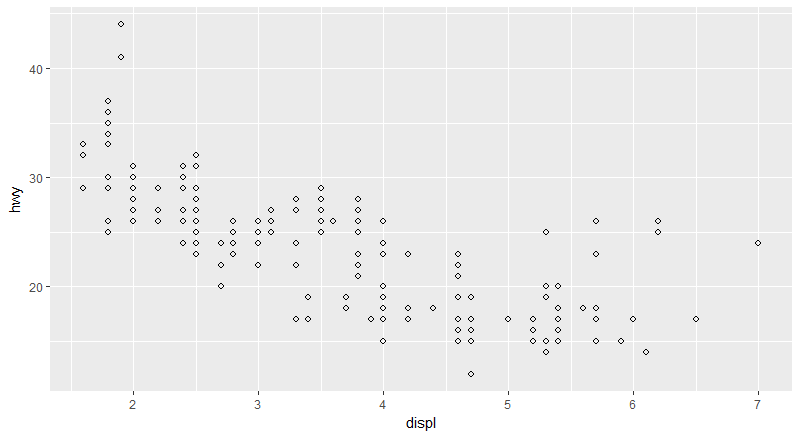
stroke=5
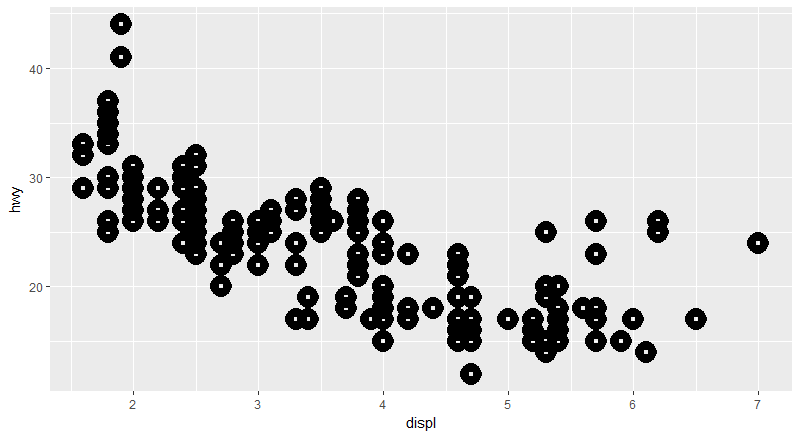
sizeとの挙動の違いがはっきりとしませんが、描画点の範囲に影響を及ぼします。
6. エステティック属性を、aes(color=displ<5)のように変数名以外にマップするとどうなるか。
第一回はここまでとして、続きを少しずつ書いていこうと思います。
