Mysqlに登録したデータをchart.jsで出力する方法の備忘録
参考記事;
https://www.youtube.com/watch?v=cREXtrFiJBc
https://www.madsycode.com/download/chartjs-mysql/
参考記事ではdb.phpとindex.phpで分けていた部分をindex.phpのみを使用して実装
事前準備
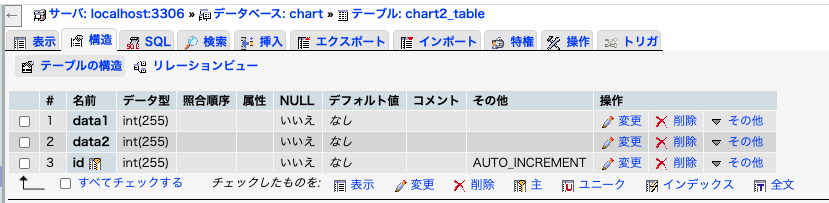
mysqlにてdbとtableを作成
db:chart
table:chart2_table
コード
index.php
<?php
include("funcs.php");

$pdo = db_conn();


	$data1 = '';
	$data2 = '';


データ登録SQL作成
//prepare("")の中にはmysqlのSQLで入力したINSERT文を入れて修正すれば良いイメージ
$stmt = $pdo->prepare("SELECT* FROM chart2_table");
$status = $stmt->execute();

	//loop through the returned data
  while( $r = $stmt->fetch(PDO::FETCH_ASSOC)){

		$data1 = $data1 . '"'. $r['data1'].'",';
		$data2 = $data2 . '"'. $r['data2'] .'",';
	}

	$data1 = trim($data1,",");
	$data2 = trim($data2,",");
?>

<!DOCTYPE html>
<html>
	<head>
    	<meta name="viewport" content="width=device-width, initial-scale=1.0">
		<script type="text/javascript" src="https://cdnjs.cloudflare.com/ajax/libs/Chart.js/2.7.2/Chart.bundle.min.js"></script>
		<title>Accelerometer data</title>

		<style type="text/css">
			body{
				font-family: Arial;
			    margin: 80px 100px 10px 100px;
			    padding: 0;
			    color: white;
			    text-align: center;
			    background: #555652;
			}

			.container {
				color: #E8E9EB;
				background: #222;
				border: #555652 1px solid;
				padding: 10px;
			}
		</style>

	</head>

	<body>
	    <div class="container">
	    <h1>MySql & Chart.js</h1>
			<canvas id="chart" style="width: 100%; height: 65vh; background: #222; border: 1px solid #555652; margin-top: 10px;"></canvas>

			<script>
				var ctx = document.getElementById("chart").getContext('2d');
    			var myChart = new Chart(ctx, {
        		type: 'line',
		        data: {
		            labels: [1,2,3,4,5,6,7,8,9],
		            datasets:
		            [{
		                label: 'Data 1',
		                data: [<?php echo $data1; ?>],
		                backgroundColor: 'transparent',
		                borderColor:'rgba(255,99,132)',
		                borderWidth: 3
		            },

		            {
		            	label: 'Data 2',
		                data: [<?php echo $data2; ?>],
		                backgroundColor: 'transparent',
		                borderColor:'rgba(0,255,255)',
		                borderWidth: 3
		            }]
		        },

		        options: {
		            scales: {scales:{yAxes: [{beginAtZero: false}], xAxes: [{autoskip: true, maxTicketsLimit: 20}]}},
		            tooltips:{mode: 'index'},
		            legend:{display: true, position: 'top', labels: {fontColor: 'rgb(255,255,255)', fontSize: 16}}
		        }
		    });
			</script>
	    </div>

	</body>
</html>
includeしているfuncs.phpは以下
<?php


//DB接続
function db_conn(){
  try {
    $db_name = "chart";    //データベース名
    $db_id   = "root";      //アカウント名
    $db_pw   = "root";      //パスワード:XAMPPはパスワード無しに修正してください。
    $db_host = "localhost"; //DBホスト
    return  $pdo = new PDO('mysql:dbname='.$db_name.';charset=utf8;host='.$db_host, $db_id, $db_pw);
  } catch (PDOException $e) {
    exit('DB Connection Error:'.$e->getMessage());
  }
}
出力結果
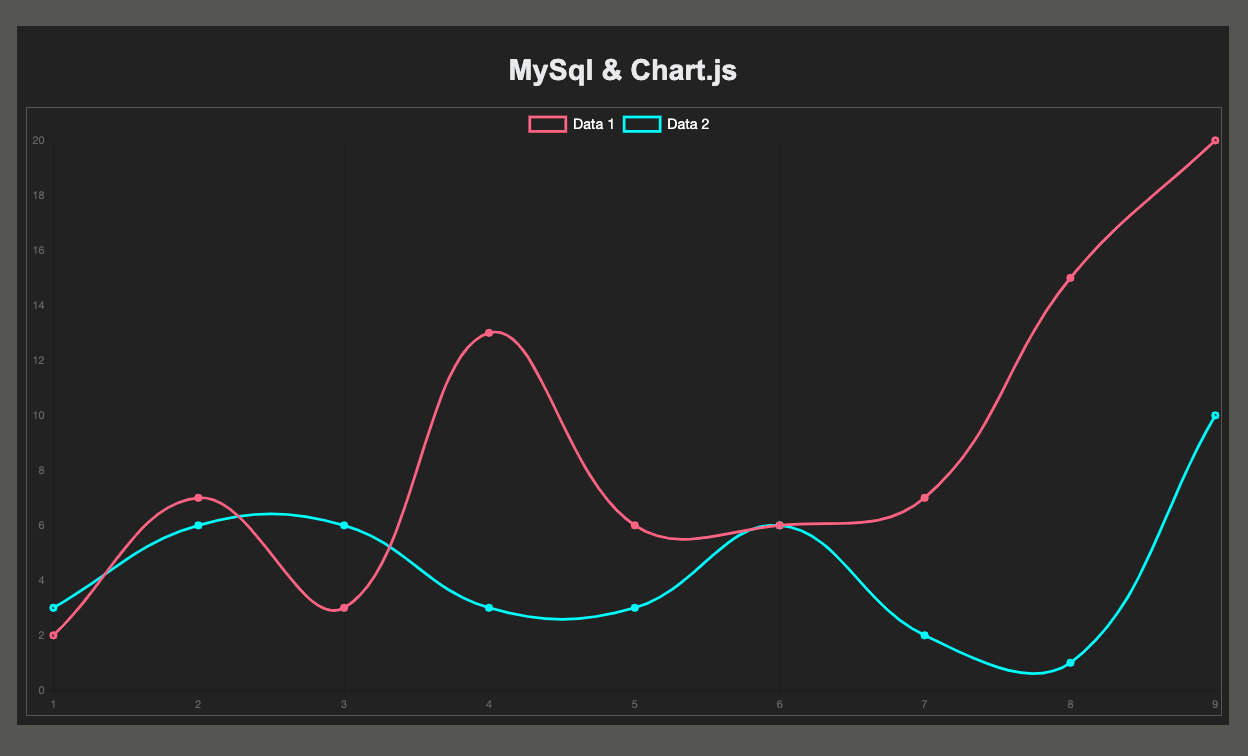
扱い自体はMySqlに登録された結果を**$r['data1'],$r['data2]で取得し、scriptタグ内でdata: [],**で呼び出しているだけ。
次回はjsonを使用し別ファイルのオブジェクトを呼び出す方法を実装していきたい。