はじめに
PySimpleGUIのサンプルプログラムを参考にファイルを読み込んでxyグラフを表示するプログラムを作ってみた。
サンプルプログラム:PySimpleGUI-cookbook-(Recipe-Compare 2 Files), (Matplotlib Window With GUI Window)
その他参考
PySimpleGUIでグラフを描く
tkinter(pySimpleGUI)でmatplotlibなしでグラフを書く方法
環境
Win10Pro
Anaconda
Python3.7
PySimpleGUIのインストールについては、前回の記事PySimpleGUIでQRコード作成GUIを作るを参考にしてください。
作成プログラム
x,yのデータが入ったCSVファイルをアップロードしてグラフを書かせるプログラム
from pathlib import Path

import matplotlib.pyplot as plt
import pandas as pd
import PySimpleGUI as sg


sg.theme('Light Blue 2')

def draw_plot(x,y):
    plt.plot(x,y)
    plt.show(block=False)
    #block=Falseの指定をしないと、その間コンソールは何も入力を受け付けなくなり、GUI を閉じないと作業復帰できない。

def check_file(file_name):
    p = Path(file_name)
    print(p.suffix)
    if p.suffix == '.csv':
        df = pd.read_csv(p)
        x = df.iloc[:,0]
        y = df.iloc[:,1]

        return x, y

    else:
        print('Wrong data file, data must be CSV')
        return None, None

layout = [[sg.Text('Enter csv data')],
          [sg.Text('File', size=(8, 1)),sg.Input(key='-file_name-'), sg.FileBrowse()],
          [sg.Submit()],
          [sg.Button('Plot'), sg.Cancel()],
          [sg.Button('Popup')]]

window = sg.Window('Plot', layout)

while True:
    event, values = window.read()

    if event in (None, 'Cancel'):
        break
    elif event in 'Submit':
        print('File name:{}'.format(values['-file_name-']))
        x,y = check_file(values['-file_name-'])

        if x[0] == None:
            sg.popup('Set file is not CSV')

    elif event == 'Plot':
        draw_plot(x,y)

    elif event == 'Popup':
        sg.popup('Yes, your application is still running')
window.close()
プログラムを実行して、ファイル名を指定します。横の'Browse'を押すと、ファイルが選べます。そして'Submit'を押します。
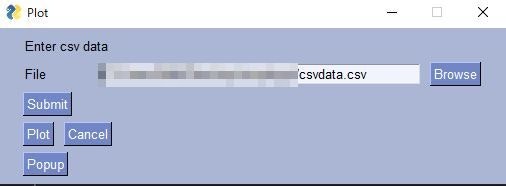
そして'Plot'を押すとグラフがプロットされます。
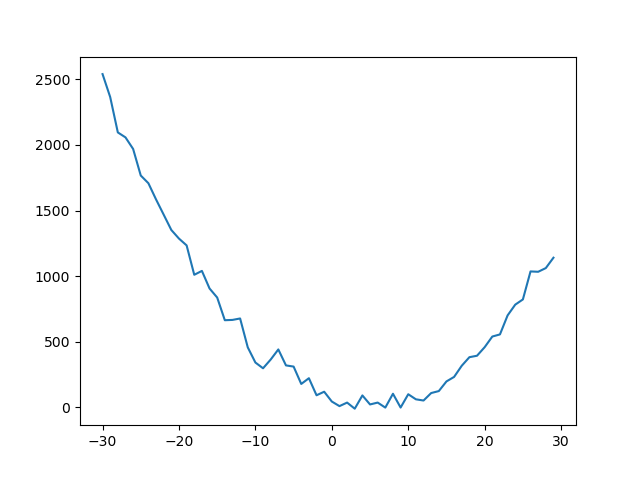
なお今回使ったCSVデータを作るプログラムはこちら
HDF5へ様々なファイルの格納で作製したものと同じです。
import numpy as np
import matplotlib.pyplot as plt
import pandas as pd

def base_func(x,a,b,c):
    y = c + a*(x - b)**2
    return y

x = np.arange(-30, 30, 1)
para = [2.0,5.0,10.0]
np.random.seed(seed=10)
y = base_func(x,para[0],para[1],para[2])+np.random.normal(0, 60, len(x))

plt.scatter(x , y)
plt.show()

# dataをdataframeでcsvにする
df = pd.DataFrame({'x':x,'y':y})
df.to_csv('csvdata.csv',index=False)
まとめ
やっぱりお手軽に作れます!