このブログでは、Raspberry Pi 4上でGridDBを使用して低コストのIndustrial Internet of Things (IIoT)ソリューションを構築し、MQTTを使用してIndustrial Shields M-DUINO 21+ Arduino PLCから温度センサーデータを読み取り、Grafanaを使用してそのデータを可視化する方法を紹介します。
目次
- ハードウェアの設定
- Raspberry Pi の設定
- MQTT
- Arduino の設定
- GridDB とGridDB WebAPI の設定
- Node.js, GridDB Node.js Client
- Node-RED の設定
- Grafana
- ハードウェアの設定
ハードウェアの設定
ハードウェアをDINレールにマウントし、温度センサーを配線し、Arduino IDEを設定し、ArduinoスケッチをPLCに展開します。
筆者は、Raspberry Pi4をDINRplateにマウントし、DINレール上にきれいに実装するため、Amazonで購入した一般的なターミナルブロックを使用しています。DINレールにすべてのものを取り付ければ、すっきりと整理整頓された状態を保つことができます。

温度センサーのアース線はM-DUINOのアース端子に接続されています。5 ボルトのワイヤーも M-DUINO の +5 VDC ピンに接続されています。センサーワイヤーは Pin2 に接続され、4.7k オームの抵抗が +5 VDC バスとセンサーバスの間に配置されています。十分な大きさの端子台があれば、複数の DS18B20 センサーを同じ M-DUINO のピンに接続することができますが、これはアナログセンサーと比較した場合に DS18B20 を使用する利点の一つです
Raspberry Pi の設定
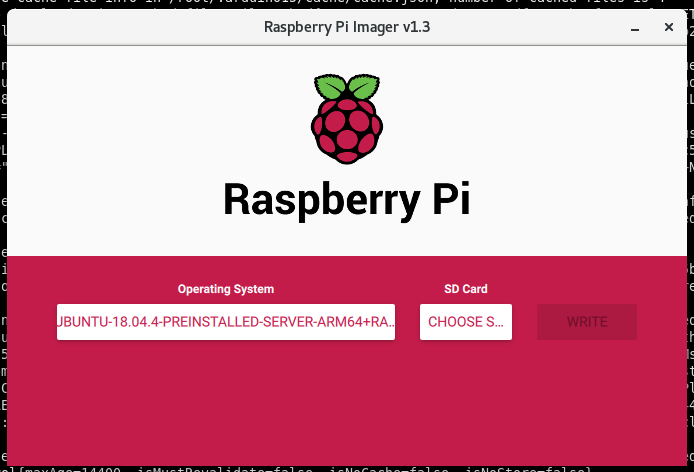
最初に、Raspberry Piを立ち上げます。次にUbuntuをインストールし、GridDBサーバ、Node.js、GridDB Node.jsクライアント、Node-RED、そして使用するノードをビルド・インストールします。GridDBは64ビットOS上で動作する必要があるので、Pi Imagerを使って64ビットのUbuntu 18.04サーバイメージをマイクロSDカードに書き込みます。

MQTT
Raspberry Pi上でMosquitto MQTTブローカーを使用します。M-DUINO はブローカ上のトピックにメッセージを公開し、Node-RED はそのトピックをサブスクライブします。今回の簡単なデモでは設定は必要ありませんので、単純にインストールして起動します。
sudo apt-get -y install mosquitto
sudo systemctl enable mosquitto
sudo systemctl start mosquitto
Arduino の設定
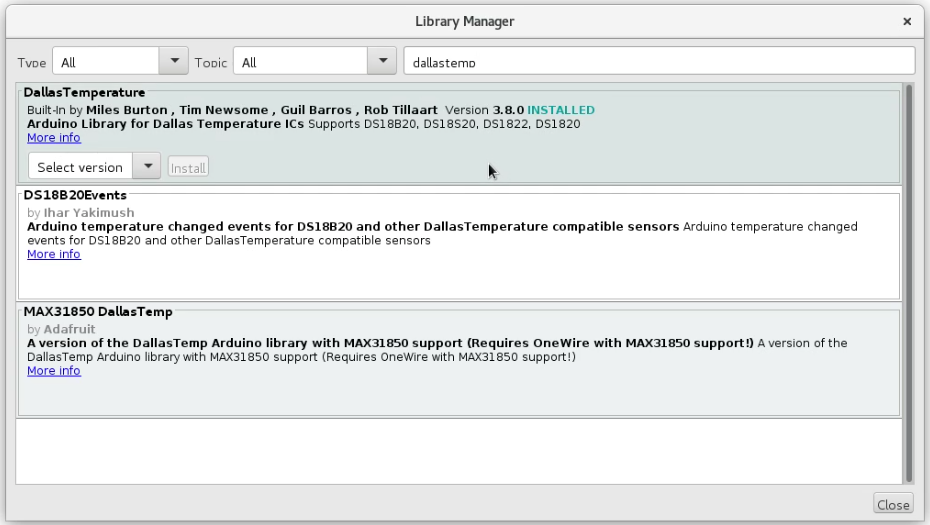
お使いのOS用のArduino IDEをインストールして起動した後(Raspberry Piでも構いませんが、筆者は開発用のワークステーションに直接接続することをおすすめします)、Arduino IDEにArduino ModbusとDallasTemperatureライブラリをインストールします。


Arduino の設定には必要なヘッダが含まれており、M-Duino の MACアドレスと IP アドレスが設定されています。DS18B20からの信号を受信するためにPIN2を使用するので、OneWireライブラリを適切に設定します。
次に、Raspberry Pi上で動作するMQTTブローカーのアドレスを設定します。スタートアップルーチンでは、イーサネット、シリアルポートを起動し、MQTTブローカーに接続します。
#include <SPI.h>
#include <Ethernet.h>
#include <ArduinoRS485.h>
#include <OneWire.h>
#include <DallasTemperature.h>
#include <ArduinoMqttClient.h>

byte mac[] = { 0xBE, 0xAD, 0xBE, 0xEF, 0xFE, 0xED };
byte ip[] = { 192, 168, 1, 100 };

#define ONE_WIRE_BUS 2
OneWire oneWire(ONE_WIRE_BUS);
DallasTemperature sensors(&oneWire);

EthernetClient etherClient;
MqttClient mqttClient(etherClient);

const char broker[] = "192.168.1.69";
int        port     = 1883;
const char topic[]  = "temp";

IPAddress server(192, 168, 1, 80); // Modbus server
void setup() {

  Ethernet.begin(mac, ip);
  Serial.begin(9600);

  if (!mqttClient.connect(broker, port)) {
    Serial.print("MQTT connection failed! Error code = ");
    Serial.println(mqttClient.connectError());

    while (1);
  }

  Serial.println("Connected to the MQTT broker!");

}
Arduinoループ機能は1秒おきに動作し、温度情報を集めてMQTTブローカーに公開します。
void loop() {

    sensors.requestTemperatures();
    float temp = sensors.getTempCByIndex(0);
    Serial.print("Temperature is: ");
    Serial.println(temp);

    mqttClient.beginMessage(topic);
    mqttClient.print("{ \"sensor\" : 1, \"temperature\" : ");
    mqttClient.print(temp);
    mqttClient.print(" }");
    mqttClient.endMessage();

    delay(1000);

}
これでArduinoのコードが完成し、コンパイル、アップロード、動作確認を行うことができるようになりました。
GridDB とGridDB WebAPI の設定
これでRaspberry Piにログインできるようになりました。ARM64ベースのRaspberry Pi上でGridDBをコンパイルして実行する方法については、このブログ記事を参照してください。
GridDBが起動したら、WebAPIをダウンロードしてインストールします。
$ wget https://github.com/griddb/webapi/releases/download/2.2.0/griddb_webapi-2.2.0-bin.tar.gz
$ tar zxvf griddb_webapi-2.2.0-bin.tar.gz
$ cd webapi/
$ export GS_WEBAPI_HOME=/home/ubuntu/webapi
$ nohup java -jar ./lib/griddb-webapi-ce-2.2.0.jar &
Node.jsとGridDB Node.js Client
Node-REDにNode.jsクライアントを構築するために必要なNode.jsとその開発用ヘッダ、NAN (Native Abstractions for Node.js) をインストールします。
sudo apt-get install nodejs nodejs-dev node-nan
次に、GridDB Node.jsクライアントが依存するPCRE、SWIGをビルドします。
$ export LD_LIBRARY_PATH=/usr/local/lib
$ wget https://sourceforge.net/projects/pcre/files/pcre/8.39/pcre-8.39.tar.gz
$ tar xvfz pcre-8.39.tar.gz
$ cd pcre-8.39
$ ./configure
$ make
$ make install

$ wget https://prdownloads.sourceforge.net/swig/swig-4.0.0.tar.gz
$ tar xvfz swig-4.0.0.tar.gz
$ cd swig-3.0.12
$ ./configure
$ make
$ make install
これで必要な前提条件が構築されたので、最後にGridDB Node.jsクライアントをGitHubからクローンしてビルドします。
$ git clone https://github.com/griddb/nodejs_client.git
$ cd nodejs_client && make
Node-RED の設定
Node-REDのインストール
次に、これから使用するNode-REDとノードをインストールします。
GridDB Node-RED Node は npm からはまだ利用できません。
$ npm install node-red
$ git clone https://github.com/griddbnet/node-red-contrib-griddb.git
$ mkdir ~/.node-red
$ cd ~/.node-red
$ npm install ~/node-red-contrib-griddb
GridDBクライアントをNODE_PATHに追加し、Node-REDを起動します。
# export NODE_PATH=:/home/ubuntu/nodejs_client
# ~/node_modules/node-red/bin/node-red-pi
Node-RED フロー
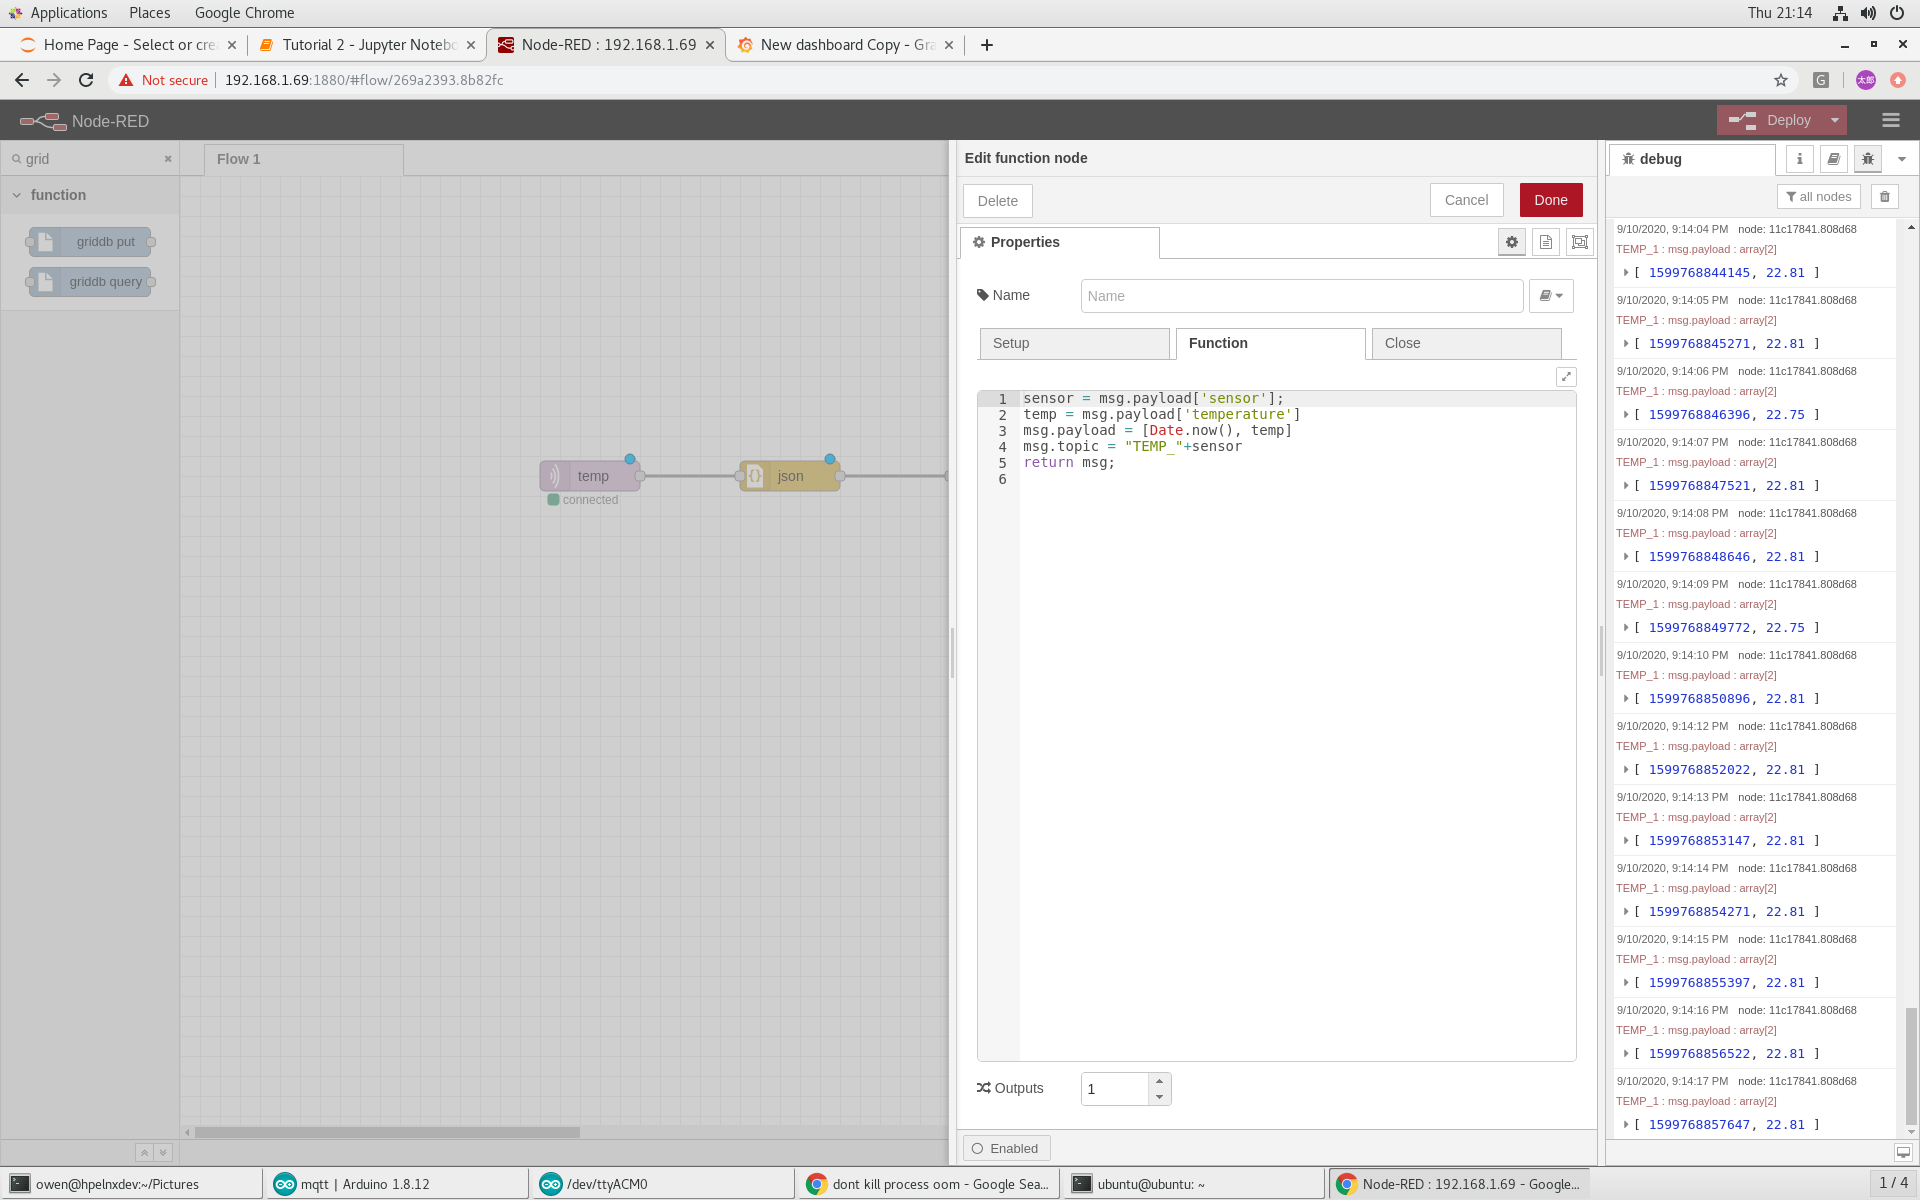
Node-REDにtempトピックをサブスクライブするMQTTリスナーを追加します。

リスナーが動作するためには、MQTT ブローカーが設定されている必要がありますが、この例ではブローカはローカルホスト上で動作しているので、特別な認証は必要ありません。

MQTTリスナーの出力は、文字列からJSONオブジェクトに変換された後、GridDB PUTノードが期待するフォーマットに変換されます。

最後に、GridDB-Put ノードでは、入力されたデータのスキーマを設定します。ここでは入力されたコンテナが msg.topic で指定されているため、コンテナ名は不要です。これにより、複数のセンサのデータを複数のコンテナに書き込むことが可能となります

Grafana
Grafanaのインストラクションに従って、Grafanaをインストールして起動します。
wget -q -O - https://packages.grafana.com/gpg.key | sudo apt-key add -
echo "deb https://packages.grafana.com/oss/deb stable main" | sudo tee -a /etc/apt/sources.list.d/grafana.list
sudo apt-get update
sudo apt-get install grafana
sudo systemctl enable grafana-server
sudo systemctl start grafana-server
次に、Grafana GridDBデータソースをダウンロードしてインストールします。
wget https://github.com/griddb/griddb-datasource/archive/1.1.0.tar.gz
tar zxvf 1.1.0.tar.gz
sudo cp -a griddb-datasource-1.1.0/dist /var/lib/grafana/plugins
sudo systemctl restart grafana-server
これでGrafanaが起動し、Webブラウザでログインすることができるようになりました。
次に、GridDBのデータソースを作成し、ホスト名、ポート、クラスタ名、ユーザ名、パスワードを入力して動作確認を行います。

データソースが動作している状態で、ダッシュボードにパネルを作成することができます。表示するコンテナと時系列を選択すると、データがプロットされます。Grafanaを使用すると、データ範囲を簡単に拡大・縮小して詳細を調べたり、長期的なトレンドを探ったりすることができます。

このプロジェクトやGridDBに関する質問があれば、Stack Overflowで気軽に質問してください。
https://ja.stackoverflow.com/questions/ask?tags=griddb
https://stackoverflow.com/questions/ask?tags=griddb
