ここ数年、時系列データベースのカテゴリが最も急速に成長しています。既存の技術分野と新興の技術分野の両方で、時系列データの作成量が増加しているのです。
一定時間内に行われるセッションの量をWebトラフィックと呼び、時間帯や曜日などによって大きく変化します。プラットフォームが処理できるWebトラフィックの量は、プラットフォームをホストするサーバーのサイズによって決定されます。
過去の訪問者数データや過去のWebトラフィックデータに基づいて、多くのサーバーを動的に割り当てることができます。つまり、過去のデータに基づいてセッションやウェブトラフィックの量を分析し、予測することがデータサイエンスの課題なのです。
チュートリアルの概要は以下の通りです。
- データセット概要
- 必要なライブラリのインポート
- データセットの読み込み
- データの可視化による分析
- 予測
- まとめ
前提条件と環境設定
jupyterの全ファイルは、GitHubのリポジトリにあります。
$ git clone --branch web-forecasting https://github.com/griddbnet/Blogs.git
このチュートリアルは、Windows オペレーティングシステム上の Anaconda Navigator (Python バージョン - 3.8.5) で実行されます。チュートリアルを続ける前に、以下のパッケージがインストールされている必要があります。
- Pandas
- NumPy
- re
- Matplotlib
- Seaborn
- griddb_python
- fbprophet
これらのパッケージは Conda の仮想環境に conda install package-name を使ってインストールすることができます。ターミナルやコマンドプロンプトから直接Pythonを使っている場合は、 pip install package-name でインストールできます。
GridDBのインストール
このチュートリアルでは、データセットをロードする際に、GridDB を使用する方法と、Pandas を使用する方法の 2 種類を取り上げます。Pythonを使用してGridDBにアクセスするためには、以下のパッケージも予めインストールしておく必要があります。
- GridDB Cクライアント
- SWIG (Simplified Wrapper and Interface Generator)
- GridDB Pythonクライアント
1. データセット概要
データセットは約145kの時系列で構成されています。これらの時系列はそれぞれ、2015年7月1日から2016年12月31日までの、異なるWikipedia記事の毎日の閲覧回数を表しています。
https://www.kaggle.com/competitions/web-traffic-time-series-forecasting/data
2. 必要なライブラリのインポート
%matplotlib inline
import pandas as pd
import numpy as np
import re
import seaborn as sns
from fbprophet import Prophet
import griddb_python as griddb

import matplotlib.pyplot as plt
plt.style.use('fivethirtyeight')

import warnings
warnings.filterwarnings("ignore")
3. データセットの読み込み
データセットはこちらからダウンロードできます:
https://www.kaggle.com/competitions/web-traffic-time-series-forecasting/data?select=train_1.csv.zip
続けて、データセットをノートブックにロードしてみましょう。
3.a GridDBを利用する
東芝GridDB™は、IoTやビッグデータに最適な高スケーラブルNoSQLデータベースです。GridDBの理念の根幹は、IoTに最適化された汎用性の高いデータストアの提供、高いスケーラビリティ、高性能なチューニング、高い信頼性の確保にあります。
大量のデータを保存する場合、CSVファイルでは面倒なことがあります。GridDBはオープンソースであり、拡張性の高いデータベースであるため、完璧な代替手段として機能します。GridDBは、スケーラブルでインメモリなNo SQLデータベースで、大量のデータを簡単に保存することができます。GridDBを初めて使う場合は、GridDBへの読み書きのチュートリアルが役に立ちます。
すでにデータベースのセットアップが完了していると仮定して、今度はデータセットをロードするためのSQLクエリをpythonで書いてみましょう。
pandasライブラリが提供するread_sql_query関数は、取得したデータをパンダのデータフレームに変換し、ユーザーが作業しやすいようにします。
sql_statement = ("SELECT * FROM train_1.csv")
df1 = pd.read_sql_query(sql_statement, cont)
変数 cont には、データが格納されているコンテナ情報が格納されていることに注意してください。credit_card_dataset をコンテナの名前に置き換えてください。詳細はチュートリアルGridDBへの読み書きに記載されています。
IoTやビッグデータのユースケースに関して言えば、GridDBはリレーショナルやNoSQLの領域の他のデータベースの中で明らかに際立っています。全体として、GridDBは高可用性とデータ保持を必要とするミッションクリティカルなアプリケーションのために、複数の信頼性機能を提供しています。
3.b pandasのread_csvを使用する
また、Pandasの read_csv 関数を使用してデータを読み込むこともできます。どちらの方法を使っても、データはpandasのdataframeの形で読み込まれるので、上記のどちらの方法も同じ出力になります。
df = pd.read_csv('train_1.csv', parse_dates=True)
df.head()
| Page | 2015-07-01 | 2015-07-02 | 2015-07-03 | 2015-07-04 | 2015-07-05 | 2015-07-06 | 2015-07-07 | 2015-07-08 | 2015-07-09 | ... | 2016-12-22 | 2016-12-23 | 2016-12-24 | 2016-12-25 | 2016-12-26 | 2016-12-27 | 2016-12-28 | 2016-12-29 | 2016-12-30 | 2016-12-31 | |
|---|---|---|---|---|---|---|---|---|---|---|---|---|---|---|---|---|---|---|---|---|---|
| 0 | 2NE1_zh.wikipedia.org_all-access_spider | 18.0 | 11.0 | 5.0 | 13.0 | 14.0 | 9.0 | 9.0 | 22.0 | 26.0 | ... | 32.0 | 63.0 | 15.0 | 26.0 | 14.0 | 20.0 | 22.0 | 19.0 | 18.0 | 20.0 |
| 1 | 2PM_zh.wikipedia.org_all-access_spider | 11.0 | 14.0 | 15.0 | 18.0 | 11.0 | 13.0 | 22.0 | 11.0 | 10.0 | ... | 17.0 | 42.0 | 28.0 | 15.0 | 9.0 | 30.0 | 52.0 | 45.0 | 26.0 | 20.0 |
| 2 | 3C_zh.wikipedia.org_all-access_spider | 1.0 | 0.0 | 1.0 | 1.0 | 0.0 | 4.0 | 0.0 | 3.0 | 4.0 | ... | 3.0 | 1.0 | 1.0 | 7.0 | 4.0 | 4.0 | 6.0 | 3.0 | 4.0 | 17.0 |
| 3 | 4minute_zh.wikipedia.org_all-access_spider | 35.0 | 13.0 | 10.0 | 94.0 | 4.0 | 26.0 | 14.0 | 9.0 | 11.0 | ... | 32.0 | 10.0 | 26.0 | 27.0 | 16.0 | 11.0 | 17.0 | 19.0 | 10.0 | 11.0 |
| 4 | 52_Hz_I_Love_You_zh.wikipedia.org_all-access_s... | NaN | NaN | NaN | NaN | NaN | NaN | NaN | NaN | NaN | ... | 48.0 | 9.0 | 25.0 | 13.0 | 3.0 | 11.0 | 27.0 | 13.0 | 36.0 | 10.0 |
5 rows × 551 columns
4. データビジュアライゼーションで分析する
トラフィックはページ言語に影響されるのか?
Wikipediaで使われている様々な言語がデータセットにどのような影響を与えるかは、調べると面白いかもしれないことの一つです。素直な正規表現を使って、wikipediaのURLに含まれる言語コードを検索してみます。
train_1 = df
def get_language(page):
    res = re.search('[a-z][a-z].wikipedia.org',page)
    if res:
        return res[0][0:2]
    return 'na'

train_1['lang'] = train_1.Page.map(get_language)

from collections import Counter

print(Counter(train_1.lang))
Counter({'en': 24108, 'ja': 20431, 'de': 18547, 'na': 17855, 'fr': 17802, 'zh': 17229, 'ru': 15022, 'es': 14069})
lang_sets = {}
lang_sets['en'] = train_1[train_1.lang=='en'].iloc[:,0:-1]
lang_sets['ja'] = train_1[train_1.lang=='ja'].iloc[:,0:-1]
lang_sets['de'] = train_1[train_1.lang=='de'].iloc[:,0:-1]
lang_sets['na'] = train_1[train_1.lang=='na'].iloc[:,0:-1]
lang_sets['fr'] = train_1[train_1.lang=='fr'].iloc[:,0:-1]
lang_sets['zh'] = train_1[train_1.lang=='zh'].iloc[:,0:-1]
lang_sets['ru'] = train_1[train_1.lang=='ru'].iloc[:,0:-1]
lang_sets['es'] = train_1[train_1.lang=='es'].iloc[:,0:-1]

sums = {}
for key in lang_sets:
    sums[key] = lang_sets[key].iloc[:,1:].sum(axis=0) / lang_sets[key].shape[0]
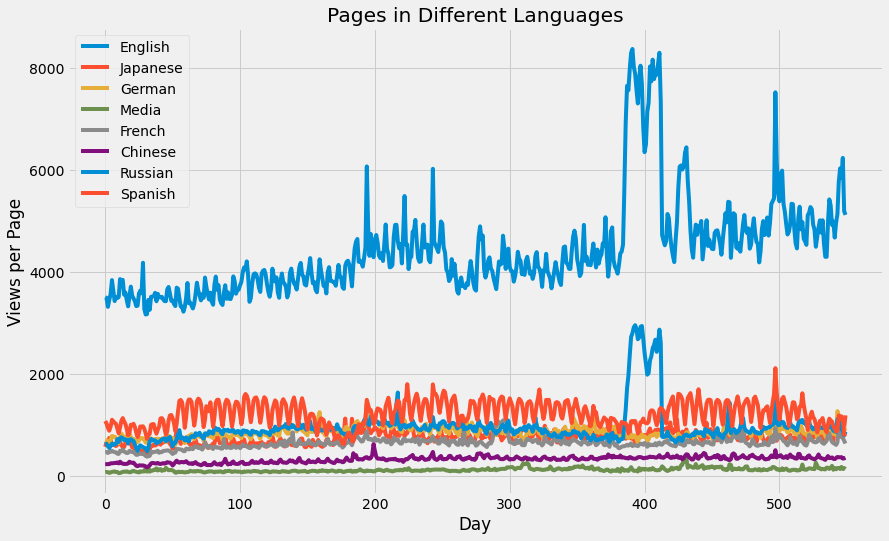
では、次に総再生回数は時間とともにどのように変化するのでしょうか。異なるセットをすべて同じプロットで表示してみます。
days = [r for r in range(sums['en'].shape[0])]

fig = plt.figure(1,figsize=[13,8])
plt.ylabel('Views per Page')
plt.xlabel('Day')
plt.title('Pages in Different Languages')
labels={'en':'English','ja':'Japanese','de':'German',
        'na':'Media','fr':'French','zh':'Chinese',
        'ru':'Russian','es':'Spanish'
       }

for key in sums:
    plt.plot(days,sums[key],label = labels[key] )

plt.legend()
plt.show()
英語は1ページあたりの閲覧数が非常に多く、これはWikipediaが米国を拠点とするサイトであることから予想されます。
df1 = df.T
df1 = df1.reset_index()
df1.head()
| Date | 2NE1_zh.wikipedia.org_all-access_spider | 2PM_zh.wikipedia.org_all-access_spider | 3C_zh.wikipedia.org_all-access_spider | 4minute_zh.wikipedia.org_all-access_spider | 52_Hz_I_Love_You_zh.wikipedia.org_all-access_spider | 5566_zh.wikipedia.org_all-access_spider | 91Days_zh.wikipedia.org_all-access_spider | A'N'D_zh.wikipedia.org_all-access_spider | AKB48_zh.wikipedia.org_all-access_spider | ... | Drake_(músico)_es.wikipedia.org_all-access_spider | Skam_(serie_de_televisión)_es.wikipedia.org_all-access_spider | Legión_(serie_de_televisión)_es.wikipedia.org_all-access_spider | Doble_tentación_es.wikipedia.org_all-access_spider | Mi_adorable_maldición_es.wikipedia.org_all-access_spider | Underworld_(serie_de_películas)_es.wikipedia.org_all-access_spider | Resident_Evil:_Capítulo_Final_es.wikipedia.org_all-access_spider | Enamorándome_de_Ramón_es.wikipedia.org_all-access_spider | Hasta_el_último_hombre_es.wikipedia.org_all-access_spider | Francisco_el_matemático_(serie_de_televisión_de_2017)_es.wikipedia.org_all-access_spider | |
|---|---|---|---|---|---|---|---|---|---|---|---|---|---|---|---|---|---|---|---|---|---|
| 1 | 2015-07-01 | 18.0 | 11.0 | 1.0 | 35.0 | NaN | 12.0 | NaN | 118.0 | 5.0 | ... | NaN | NaN | NaN | NaN | NaN | NaN | NaN | NaN | NaN | NaN |
| 2 | 2015-07-02 | 11.0 | 14.0 | 0.0 | 13.0 | NaN | 7.0 | NaN | 26.0 | 23.0 | ... | NaN | NaN | NaN | NaN | NaN | NaN | NaN | NaN | NaN | NaN |
| 3 | 2015-07-03 | 5.0 | 15.0 | 1.0 | 10.0 | NaN | 4.0 | NaN | 30.0 | 14.0 | ... | NaN | NaN | NaN | NaN | NaN | NaN | NaN | NaN | NaN | NaN |
| 4 | 2015-07-04 | 13.0 | 18.0 | 1.0 | 94.0 | NaN | 5.0 | NaN | 24.0 | 12.0 | ... | NaN | NaN | NaN | NaN | NaN | NaN | NaN | NaN | NaN | NaN |
| 5 | 2015-07-05 | 14.0 | 11.0 | 0.0 | 4.0 | NaN | 20.0 | NaN | 29.0 | 9.0 | ... | NaN | NaN | NaN | NaN | NaN | NaN | NaN | NaN | NaN | NaN |
5 rows × 145064 columns
df1=df1[:550]
column_header = df1.iloc[0,:].values

df1.columns = column_header

df1 = df1.drop(0, axis = 0)
df1 = df1.rename(columns = {"Page" : "Date"})
df1["Date"] = pd.to_datetime(df1["Date"], format='%Y-%m-%d')
df1 = df1.set_index("Date")
# Finding number of access types and agents
access_types = []
agents = []
for column in df1.columns:
    access_type = column.split("_")[-2]
    agent = column.split("_")[-1]
    access_types.append(access_type)
    agents.append(agent)
# Counting access types
from collections import Counter
access_dict = Counter(access_types)
access_dict
Counter({'all-access': 74315, 'desktop': 34809, 'mobile-web': 35939})
access_df = pd.DataFrame({"Access type" : access_dict.keys(),
                          "Number of columns" : access_dict.values()})
access_df
| Access type | Number of columns | |
|---|---|---|
| 0 | all-access | 74315 |
| 1 | desktop | 34809 |
| 2 | mobile-web | 35939 |
agents_dict = Counter(agents)
agents_dict
Counter({'spider': 34913, 'all-agents': 110150})
agents_df = pd.DataFrame({"Agent" : agents_dict.keys(),
                          "Number of columns" : agents_dict.values()})
agents_df
| Agent | Number of columns | |
|---|---|---|
| 0 | spider | 34913 |
| 1 | all-agents | 110150 |
df1.columns[86543].split("_")[-3:]
"_".join(df1.columns[86543].split("_")[-3:])

projects = []
for column in df1.columns:
    project = column.split("_")[-3]
    projects.append(project)
project_dict = Counter(projects)
project_df = pd.DataFrame({"Project" : project_dict.keys(),
                           "Number of columns" : project_dict.values()})

project_df
| Project | Number of columns | |
|---|---|---|
| 0 | zh.wikipedia.org | 17229 |
| 1 | fr.wikipedia.org | 17802 |
| 2 | en.wikipedia.org | 24108 |
| 3 | commons.wikimedia.org | 10555 |
| 4 | ru.wikipedia.org | 15022 |
| 5 | www.mediawiki.org | 7300 |
| 6 | de.wikipedia.org | 18547 |
| 7 | ja.wikipedia.org | 20431 |
| 8 | es.wikipedia.org | 14069 |
def extract_average_views(project):
    required_column_names = [column for column in df1.columns if project in column]
    average_views = df1[required_column_names].sum().mean()
    return average_views

average_views = []
for project in project_df["Project"]:
    average_views.append(extract_average_views(project))
project_df["Average views"] = average_views
project_df['Average views'] = project_df['Average views'].astype('int64')
project_df
| Project | Number of columns | Average views | |
|---|---|---|---|
| 0 | zh.wikipedia.org | 17229 | 184107 |
| 1 | fr.wikipedia.org | 17802 | 358264 |
| 2 | en.wikipedia.org | 24108 | 2436898 |
| 3 | commons.wikimedia.org | 10555 | 99429 |
| 4 | ru.wikipedia.org | 15022 | 532443 |
| 5 | www.mediawiki.org | 7300 | 31411 |
| 6 | de.wikipedia.org | 18547 | 477813 |
| 7 | ja.wikipedia.org | 20431 | 419523 |
| 8 | es.wikipedia.org | 14069 | 674546 |
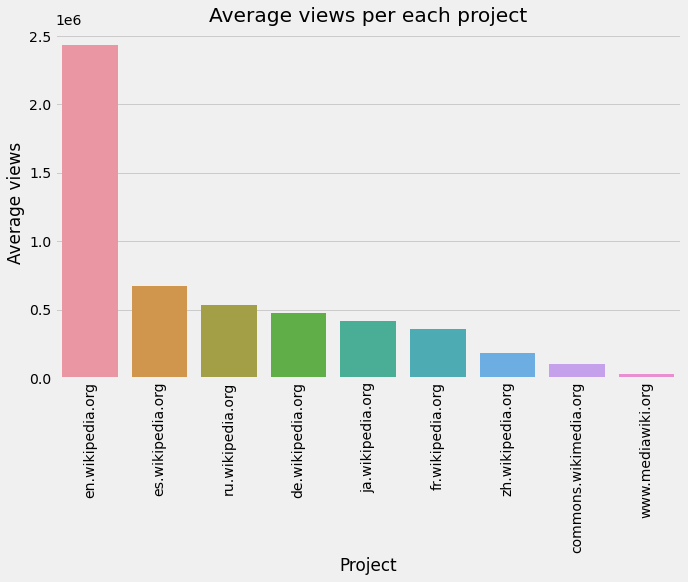
project_df_sorted = project_df.sort_values(by = "Average views", ascending = False)
plt.figure(figsize = (10,6))
sns.barplot(x = project_df_sorted["Project"], y = project_df_sorted["Average views"])
plt.xticks(rotation = "vertical")
plt.title("Average views per each project")
plt.show()
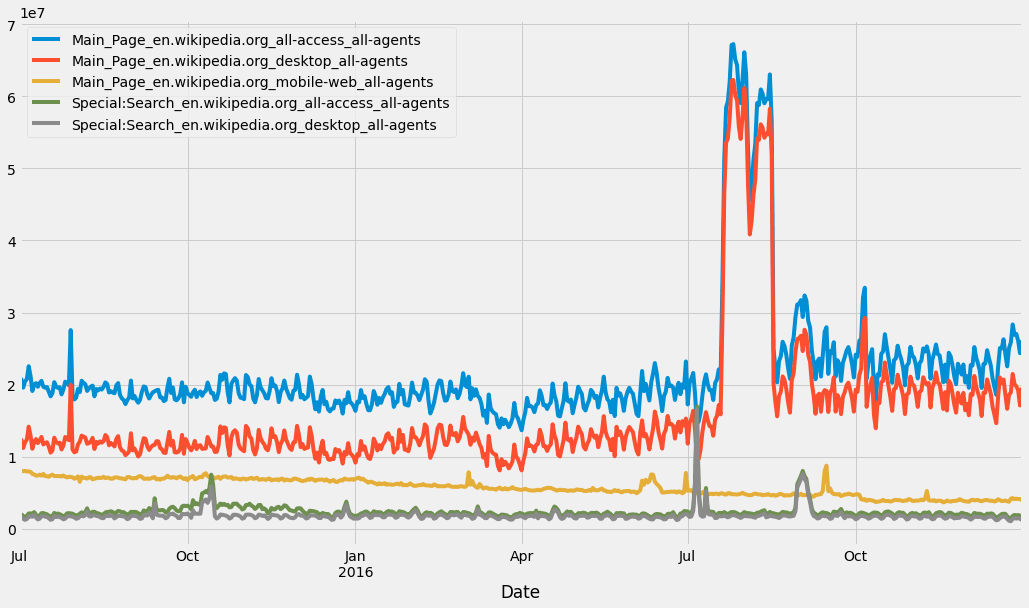
"en.wikipedia.org" の人気ページ
en_wikipedia_org_columns = [column for column in df1.columns if "en.wikipedia.org" in column]

top_pages_en = df1[en_wikipedia_org_columns].mean().sort_values(ascending = False)[0:5]
df1[top_pages_en.index].plot(figsize = (16,9))
<AxesSubplot:xlabel='Date'>
5. 予測
train = df
train
| Page | 2015-07-01 | 2015-07-02 | 2015-07-03 | 2015-07-04 | 2015-07-05 | 2015-07-06 | 2015-07-07 | 2015-07-08 | 2015-07-09 | ... | 2016-12-23 | 2016-12-24 | 2016-12-25 | 2016-12-26 | 2016-12-27 | 2016-12-28 | 2016-12-29 | 2016-12-30 | 2016-12-31 | lang | |
|---|---|---|---|---|---|---|---|---|---|---|---|---|---|---|---|---|---|---|---|---|---|
| 0 | 2NE1_zh.wikipedia.org_all-access_spider | 18.0 | 11.0 | 5.0 | 13.0 | 14.0 | 9.0 | 9.0 | 22.0 | 26.0 | ... | 63.0 | 15.0 | 26.0 | 14.0 | 20.0 | 22.0 | 19.0 | 18.0 | 20.0 | zh |
| 1 | 2PM_zh.wikipedia.org_all-access_spider | 11.0 | 14.0 | 15.0 | 18.0 | 11.0 | 13.0 | 22.0 | 11.0 | 10.0 | ... | 42.0 | 28.0 | 15.0 | 9.0 | 30.0 | 52.0 | 45.0 | 26.0 | 20.0 | zh |
| 2 | 3C_zh.wikipedia.org_all-access_spider | 1.0 | 0.0 | 1.0 | 1.0 | 0.0 | 4.0 | 0.0 | 3.0 | 4.0 | ... | 1.0 | 1.0 | 7.0 | 4.0 | 4.0 | 6.0 | 3.0 | 4.0 | 17.0 | zh |
| 3 | 4minute_zh.wikipedia.org_all-access_spider | 35.0 | 13.0 | 10.0 | 94.0 | 4.0 | 26.0 | 14.0 | 9.0 | 11.0 | ... | 10.0 | 26.0 | 27.0 | 16.0 | 11.0 | 17.0 | 19.0 | 10.0 | 11.0 | zh |
| 4 | 52_Hz_I_Love_You_zh.wikipedia.org_all-access_s... | NaN | NaN | NaN | NaN | NaN | NaN | NaN | NaN | NaN | ... | 9.0 | 25.0 | 13.0 | 3.0 | 11.0 | 27.0 | 13.0 | 36.0 | 10.0 | zh |
| ... | ... | ... | ... | ... | ... | ... | ... | ... | ... | ... | ... | ... | ... | ... | ... | ... | ... | ... | ... | ... | ... |
| 145058 | Underworld_(serie_de_películas)_es.wikipedia.o... | NaN | NaN | NaN | NaN | NaN | NaN | NaN | NaN | NaN | ... | NaN | NaN | NaN | 13.0 | 12.0 | 13.0 | 3.0 | 5.0 | 10.0 | es |
| 145059 | Resident_Evil:_Capítulo_Final_es.wikipedia.org... | NaN | NaN | NaN | NaN | NaN | NaN | NaN | NaN | NaN | ... | NaN | NaN | NaN | NaN | NaN | NaN | NaN | NaN | NaN | es |
| 145060 | Enamorándome_de_Ramón_es.wikipedia.org_all-acc... | NaN | NaN | NaN | NaN | NaN | NaN | NaN | NaN | NaN | ... | NaN | NaN | NaN | NaN | NaN | NaN | NaN | NaN | NaN | es |
| 145061 | Hasta_el_último_hombre_es.wikipedia.org_all-ac... | NaN | NaN | NaN | NaN | NaN | NaN | NaN | NaN | NaN | ... | NaN | NaN | NaN | NaN | NaN | NaN | NaN | NaN | NaN | es |
| 145062 | Francisco_el_matemático_(serie_de_televisión_d... | NaN | NaN | NaN | NaN | NaN | NaN | NaN | NaN | NaN | ... | NaN | NaN | NaN | NaN | NaN | NaN | NaN | NaN | NaN | es |
145063 rows × 552 columns
train=pd.melt(df[list(df.columns[-50:])+['Page']], id_vars='Page', var_name='date', value_name='Visits')
list1 = ['lang']
train = train[train.date.isin(list1) == False]
train
| Page | date | Visits | |
|---|---|---|---|
| 0 | 2NE1_zh.wikipedia.org_all-access_spider | 2016-11-13 | 8.0 |
| 1 | 2PM_zh.wikipedia.org_all-access_spider | 2016-11-13 | 11.0 |
| 2 | 3C_zh.wikipedia.org_all-access_spider | 2016-11-13 | 4.0 |
| 3 | 4minute_zh.wikipedia.org_all-access_spider | 2016-11-13 | 13.0 |
| 4 | 52_Hz_I_Love_You_zh.wikipedia.org_all-access_s... | 2016-11-13 | 11.0 |
| ... | ... | ... | ... |
| 7108082 | Underworld_(serie_de_películas)_es.wikipedia.o... | 2016-12-31 | 10.0 |
| 7108083 | Resident_Evil:_Capítulo_Final_es.wikipedia.org... | 2016-12-31 | NaN |
| 7108084 | Enamorándome_de_Ramón_es.wikipedia.org_all-acc... | 2016-12-31 | NaN |
| 7108085 | Hasta_el_último_hombre_es.wikipedia.org_all-ac... | 2016-12-31 | NaN |
| 7108086 | Francisco_el_matemático_(serie_de_televisión_d... | 2016-12-31 | NaN |
7108087 rows × 3 columns
train['date'] = train['date'].astype('datetime64[ns]')
train['weekend'] = ((train.date.dt.dayofweek) // 5 == 1).astype(float)
median = pd.DataFrame(train.groupby(['Page'])['Visits'].median())
median.columns = ['median']
mean = pd.DataFrame(train.groupby(['Page'])['Visits'].mean())
mean.columns = ['mean']

train = train.set_index('Page').join(mean).join(median)
train.reset_index(drop=False,inplace=True)
train['weekday'] = train['date'].apply(lambda x: x.weekday())

train['year']=train.date.dt.year
train['month']=train.date.dt.month
train['day']=train.date.dt.day
mean_g = train[['Page','date','Visits']].groupby(['date'])['Visits'].mean()

means =  pd.DataFrame(mean_g).reset_index(drop=False)
means['weekday'] =means['date'].apply(lambda x: x.weekday())

means['Date_str'] = means['date'].apply(lambda x: str(x))

#create new columns year,month,day in the dataframe bysplitting the date string on hyphen and converting them to a list of values and add them under the column names year,month and day
means[['year','month','day']] = pd.DataFrame(means['Date_str'].str.split('-',2).tolist(), columns = ['year','month','day'])

#creating a new dataframe date by splitting the day column into 2 in the means data frame on sapce, to understand these steps look at the subsequent cells to understand how the day column looked before this step
date = pd.DataFrame(means['day'].str.split(' ',2).tolist(), columns = ['day','other'])
means['day'] = date['day']*1
means.drop('Date_str',axis = 1, inplace =True)
import seaborn as sns
sns.set(font_scale=1)

date_index = means[['date','Visits']]
date_index = date_index.set_index('date')

prophet = date_index.copy()
prophet.reset_index(drop=False,inplace=True)
prophet.columns = ['ds','y']

m = Prophet()
m.fit(prophet)

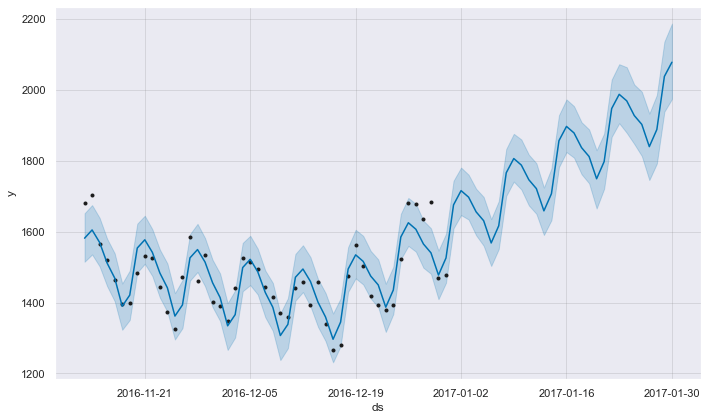
future = m.make_future_dataframe(periods=30,freq='D')
forecast = m.predict(future)

fig = m.plot(forecast)
INFO:fbprophet:Disabling yearly seasonality. Run prophet with yearly_seasonality=True to override this.
INFO:fbprophet:Disabling daily seasonality. Run prophet with daily_seasonality=True to override this.
6. 結論
このチュートリアルでは、PythonとGridDBを使用してWebトラフィックを分析し、予測しました。データのインポート方法として、(1) GridDB と (2) Pandas の2つの方法を検討しました。GridDBは、オープンソースで拡張性が高いため、大規模なデータセットの場合、ノートブックにデータをインポートするための優れた代替手段を提供します。


