はじめに
この記事では、R言語の仕様について少し深い話をします。
内容は前の記事に関連するので、興味ある方は読んでみてください:
あれ?パイプがいうことを聞いてくれない、、、
やりたいことは簡単です。
> g <-  tibble::tibble(
     x = rnorm(100)
 ) |>
     dplyr::mutate(
         noise = rnorm(dplyr::n())
     ) |>
     dplyr::mutate(
         y = 1.2 * x + noise
     ) |>
     ggplot2::ggplot() +
     ggplot2::geom_point(ggplot2::aes(x = x, y = y), color = ggplot2::alpha("blue", 0.3)) +
     ggplot2::ggtitle("可視化です") +
     ggplot2::theme_gray(base_family = "HiraKakuPro-W3")
> g
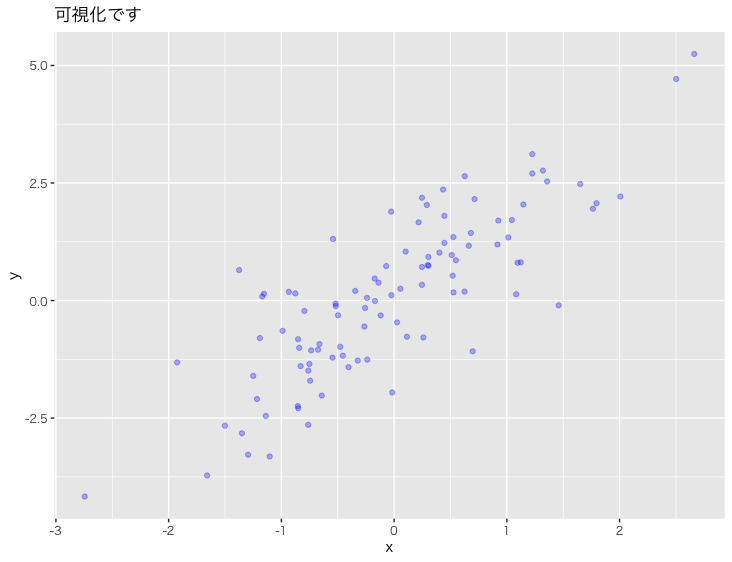
再現性はあまり本質的ではないので、seed関連は省略します。ごめんなさい。
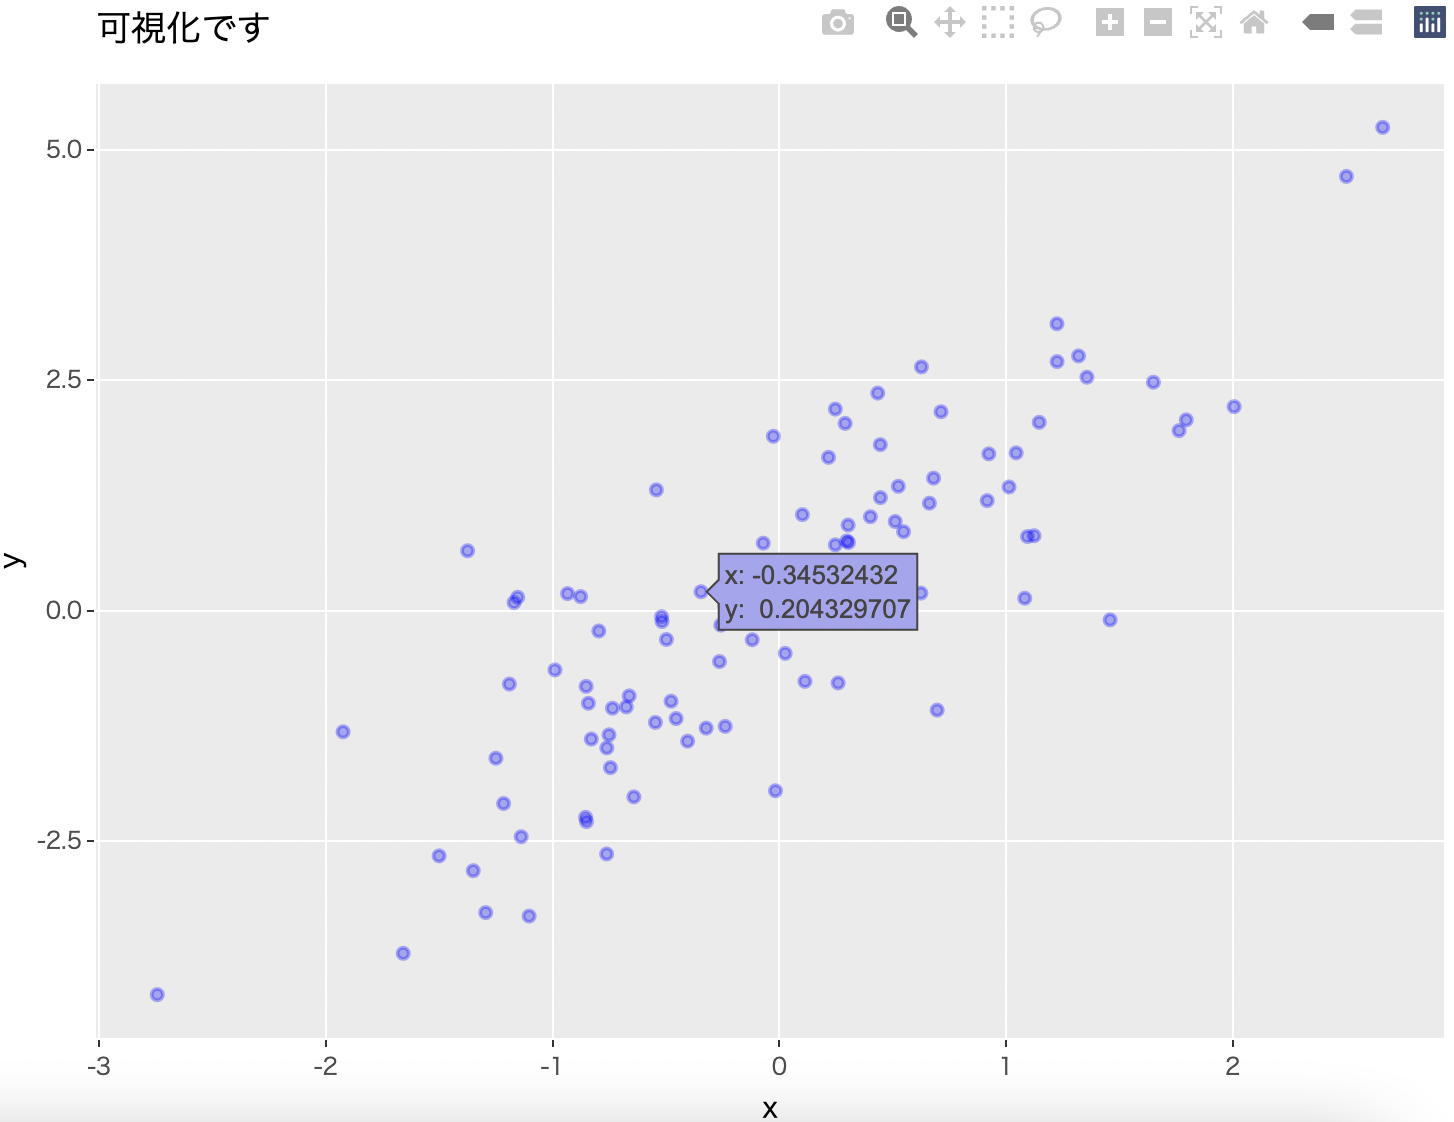
このggplot2のグラフをplotlyのインタラクティブなグラフにしたいだけです:
> plotly::ggplotly(g)
でも、わざわざgという中間変数を設定するのではなく、直接パイプでつなげたいですね。こんな感じで:
> tibble::tibble(
     x = rnorm(100)
 ) |>
     dplyr::mutate(
         noise = rnorm(dplyr::n())
     ) |>
     dplyr::mutate(
         y = 1.2 * x + noise
     ) |>
     ggplot2::ggplot() +
     ggplot2::geom_point(ggplot2::aes(x = x, y = y), color = ggplot2::alpha("blue", 0.3)) +
     ggplot2::ggtitle("可視化です") +
     ggplot2::theme_gray(base_family = "HiraKakuPro-W3") |>
     plotly::ggplotly()
Error in UseMethod("ggplotly", p) :
  no applicable method for 'ggplotly' applied to an object of class "c('theme', 'gg')"
あれ、、、エラーが、、、
抽象構文木で挙動を確認する
ではまず、上のエラーを引き起こしたRのコードは一体どんな順序で実行されたのかを見てみます。
Rのlobstrパッケージにそのまま調べたいコードを渡せば抽象構文木を可視化してくれます。
> lobstr::ast(
     tibble::tibble(
         x = rnorm(100)
     ) |>
         dplyr::mutate(
             noise = rnorm(dplyr::n())
         ) |>
         dplyr::mutate(
             y = 1.2 * x + noise
         ) |>
         ggplot2::ggplot() +
         ggplot2::geom_point(ggplot2::aes(x = x, y = y), color = ggplot2::alpha("blue", 0.3)) +
         ggplot2::ggtitle("可視化です") +
         ggplot2::theme_gray(base_family = "HiraKakuPro-W3") |>
         plotly::ggplotly()
 )
█─`+`
├─█─`+`
│ ├─█─`+`
│ │ ├─█─█─`::`
│ │ │ │ ├─ggplot2
│ │ │ │ └─ggplot
│ │ │ └─█─█─`::`
│ │ │   │ ├─dplyr
│ │ │   │ └─mutate
│ │ │   ├─█─█─`::`
│ │ │   │ │ ├─dplyr
│ │ │   │ │ └─mutate
│ │ │   │ ├─█─█─`::`
│ │ │   │ │ │ ├─tibble
│ │ │   │ │ │ └─tibble
│ │ │   │ │ └─x = █─rnorm
│ │ │   │ │       └─100
│ │ │   │ └─noise = █─rnorm
│ │ │   │           └─█─█─`::`
│ │ │   │               ├─dplyr
│ │ │   │               └─n
│ │ │   └─y = █─`+`
│ │ │         ├─█─`*`
│ │ │         │ ├─1.2
│ │ │         │ └─x
│ │ │         └─noise
│ │ └─█─█─`::`
│ │   │ ├─ggplot2
│ │   │ └─geom_point
│ │   ├─█─█─`::`
│ │   │ │ ├─ggplot2
│ │   │ │ └─aes
│ │   │ ├─x = x
│ │   │ └─y = y
│ │   └─color = █─█─`::`
│ │             │ ├─ggplot2
│ │             │ └─alpha
│ │             ├─"blue"
│ │             └─0.3
│ └─█─█─`::`
│   │ ├─ggplot2
│   │ └─ggtitle
│   └─"可視化です"
└─█─█─`::`
  │ ├─plotly
  │ └─ggplotly
  └─█─█─`::`
    │ ├─ggplot2
    │ └─theme_gray
    └─base_family = "HiraKakuPro-W3"
なるほど、どうやらggplot2の最後の
ggplot2::theme_gray(base_family = "HiraKakuPro-W3") |>
         plotly::ggplotly()
が先に実行されちゃったようです。
簡単な事例
では、前回の記事でも述べたように、「+」は普通の関数なので、抽象構文木に慣れていない方のために、まずはより簡単な事例で+とパイプの実行順序を見ましょう。
まず、このコードについて考えてみてください:
1 + 5 |> sin() + 2 |> exp()
さて、sin関数に入るのは5なのか、それとも6(つまり5 + 1)なのか?
答えを見ましょう!
> 1 + 5 |> sin() + 2 |> exp()
[1] 7.430132
> lobstr::ast(1 + 5 |> sin() + 2 |> exp())
█─`+`
├─█─`+`
│ ├─1
│ └─█─sin
│   └─5
└─█─exp
  └─2
なるほど、5が先にsin関数に入れられてから、+関数を呼び出して1とsin(5)の足し算を実行しました。
なので、パイプ演算子の優先順位は+より高いことがわかりました。
ではどうしても6をsin関数に入れたいときはどうすればいいのかというと、()で囲めばいいです。
> (1 + 5) |> sin() + 2 |> exp()
[1] 7.109641
> lobstr::ast((1 + 5) |> sin() + 2 |> exp())
█─`+`
├─█─sin
│ └─█─`(`
│   └─█─`+`
│     ├─1
│     └─5
└─█─exp
  └─2
()関数(そう、カッコも実は関数なんですよ)のおかげで1と5の間の足し算がsin関数より先に実行されました。
なので普通の数式の計算のように、()で先に実行する計算を囲めば、実行順序を変えられます。
解決方法
では、早速やってみましょう:
> (
     tibble::tibble(
         x = rnorm(100)
     ) |>
     dplyr::mutate(
         noise = rnorm(dplyr::n())
     ) |>
     dplyr::mutate(
         y = 1.2 * x + noise
     ) |>
     ggplot2::ggplot() +
     ggplot2::geom_point(ggplot2::aes(x = x, y = y), color = ggplot2::alpha("blue", 0.3)) +
     ggplot2::ggtitle("可視化です") +
     ggplot2::theme_gray(base_family = "HiraKakuPro-W3")
 ) |>
     plotly::ggplotly()
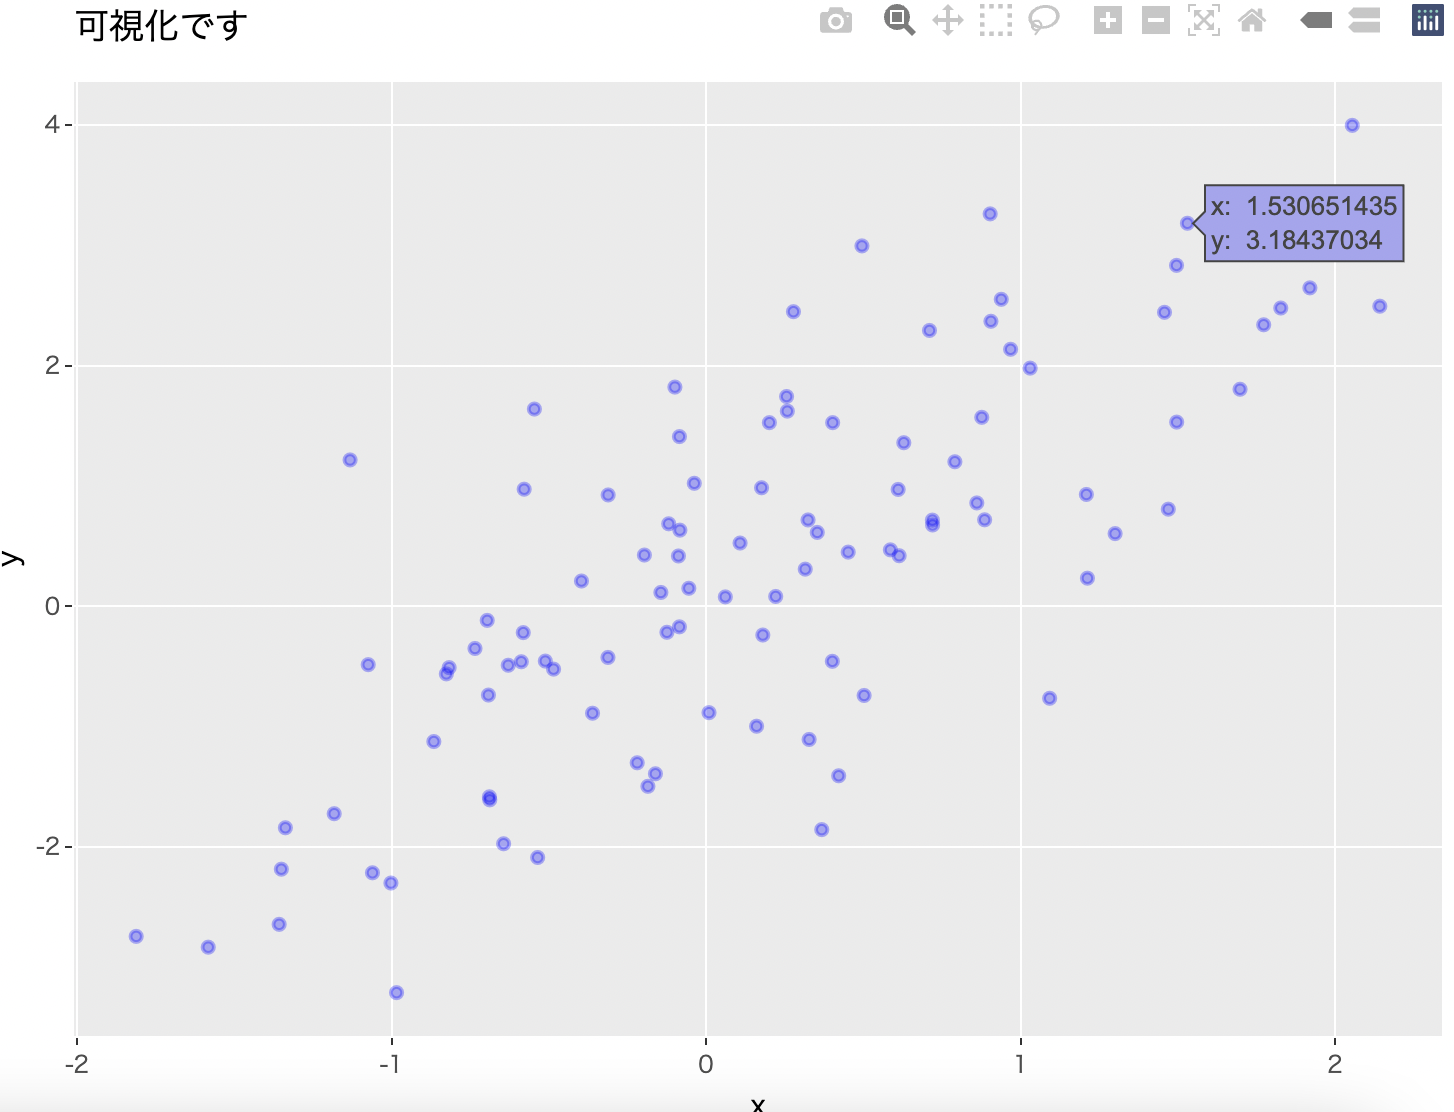
できました!
抽象構文木も確認しましょう:
> lobstr::ast(
     (
         tibble::tibble(
             x = rnorm(100)
         ) |>
             dplyr::mutate(
                 noise = rnorm(dplyr::n())
             ) |>
             dplyr::mutate(
                 y = 1.2 * x + noise
             ) |>
             ggplot2::ggplot() +
             ggplot2::geom_point(ggplot2::aes(x = x, y = y), color = ggplot2::alpha("blue", 0.3)) +
             ggplot2::ggtitle("可視化です") +
             ggplot2::theme_gray(base_family = "HiraKakuPro-W3")
     ) |>
         plotly::ggplotly()
 )
█─█─`::`
│ ├─plotly
│ └─ggplotly
└─█─`(`
  └─█─`+`
    ├─█─`+`
    │ ├─█─`+`
    │ │ ├─█─█─`::`
    │ │ │ │ ├─ggplot2
    │ │ │ │ └─ggplot
    │ │ │ └─█─█─`::`
    │ │ │   │ ├─dplyr
    │ │ │   │ └─mutate
    │ │ │   ├─█─█─`::`
    │ │ │   │ │ ├─dplyr
    │ │ │   │ │ └─mutate
    │ │ │   │ ├─█─█─`::`
    │ │ │   │ │ │ ├─tibble
    │ │ │   │ │ │ └─tibble
    │ │ │   │ │ └─x = █─rnorm
    │ │ │   │ │       └─100
    │ │ │   │ └─noise = █─rnorm
    │ │ │   │           └─█─█─`::`
    │ │ │   │               ├─dplyr
    │ │ │   │               └─n
    │ │ │   └─y = █─`+`
    │ │ │         ├─█─`*`
    │ │ │         │ ├─1.2
    │ │ │         │ └─x
    │ │ │         └─noise
    │ │ └─█─█─`::`
    │ │   │ ├─ggplot2
    │ │   │ └─geom_point
    │ │   ├─█─█─`::`
    │ │   │ │ ├─ggplot2
    │ │   │ │ └─aes
    │ │   │ ├─x = x
    │ │   │ └─y = y
    │ │   └─color = █─█─`::`
    │ │             │ ├─ggplot2
    │ │             │ └─alpha
    │ │             ├─"blue"
    │ │             └─0.3
    │ └─█─█─`::`
    │   │ ├─ggplot2
    │   │ └─ggtitle
    │   └─"可視化です"
    └─█─█─`::`
      │ ├─ggplot2
      │ └─theme_gray
      └─base_family = "HiraKakuPro-W3"
これで問題なく、ggplot2のオブジェクトを丸ごとplotly::ggplotlyの第一引数として渡せました。
結論
以前の記事でも強調したのですが、Rはいわゆる「統計ソフト」ではなく、JavaScript、Go、Python、Scalaと同じように、普通のプログラミング言語です。ウェブサイトとAPIの構築、ユーザーの操作ログ追跡、並びにスクレイピングも自由自在にできる普通の一言語として、開発者はその言語仕様をしっかり理解しないといけません。
あ、そうです、ちなみにRはデータ分析もできます。ちなみに。
Rの場合、実行順序に不安がある場合、まずはlobstr::astで抽象構文木を覗いてみることをお勧めします。