はじめに
私はPythonで実験データなどの操作を行っています。現在機械学習とかでも活発に使われている言語なので特に特記することもないかと思います。ライブラリが豊富であり、記述が簡単で精度さえ注意すれば素晴らしい言語だと思っています。
ちなみに研究室ではMathematicaが使われています。ただ、容量がデカく、ライセンスの関係で自宅で作業ができず、買おうと思うとAd○beレベルで高いので、よほどのことがない限り使ってないです。教授は「べつに使いたい言語つかったらいいよ〜」と言っていたので問題はない(はず)です。
そんな感じの理由で全ての計算をPythonで行っているのですが、一点だけ問題があり論文で使用できるグラフのテンプレが存在しなかったです。なので自分でイチからプログラムを作ったというのが経緯です。
グラフに必要な条件
そもそもグラフで何が求められているのかを考えます。それは物理量の関係性を鮮明にすることが目的です。それを実現するためには下のようなものを意識する必要があると考えています。
- 単位やパラメーターの意味を示す
- 目盛りも読みやすいような工夫をしておく
- 凡例をわかりやすく明記しておく
- 白黒で分かるように作成する
これらを意識してmatplotlibを使ってプログラムを作成して、俗に言う秘伝のタレのようにコピペでやってきていました。ただ、流石にグラフの作成量が多くなると面倒になってきてしまったので、ある程度自動化させたプログラムにしました。
これらを実現するために入れているアイデアとしては下のようなものが挙げられます。
- 軸名と凡例を絶対に入れないといけない仕様
- 目盛りを自動で5分割できる仕様
作成したもの
from matplotlib import pyplot as plt
from matplotlib.ticker import ScalarFormatter
from pylab import *
import warnings

plt.rcParams["xtick.direction"] = "in"
plt.rcParams["ytick.direction"] = "in"

# graphs = [{"type":"yerror","x":[0,1,2],"y":[0,1,2],"xerr":[0.1,0.1,0.1],"yerr":[0.2,0.3,0.2],"marker":".","color":"tomato","label":"hoge","linestyle":"dashed"}]
# type -> "errory", "errorx", "errorxy", "plot", "scatter"
# range = {"xmax":10,"ymax":10, "xmin":0, "ymin":0}

def make_graph(graphs,xlabel,ylabel,range,fileName,legend=True,grid=True,show=False,capsize=3,xscale_log=False,yscale_log=False,dpi=300):
    fig,ax=plt.subplots(figsize=(7,4))

    for datas in graphs:
        if datas["type"] == "errory":
            ax.errorbar(datas["x"],datas["y"],yerr=datas["yerr"],marker=datas["marker"],color=datas["color"],label=datas["label"],capsize=capsize,linestyle=datas["linestyle"])
        elif datas["type"] == "errorx":
            ax.errorbar(datas["x"],datas["y"],xerr=datas["xerr"],marker=datas["marker"],color=datas["color"],label=datas["label"],capsize=capsize,linestyle=datas["linestyle"])
        elif datas["type"] == "errorxy":
            ax.errorbar(datas["x"],datas["y"],xerr=datas["xerr"],yerr=datas["yerr"],marker=datas["marker"],color=datas["color"],label=datas["label"],capsize=capsize,linestyle=datas["linestyle"])
        elif datas["type"] == "plot":
            ax.plot(datas["x"],datas["y"],marker=datas["marker"],color=datas["color"],label=datas["label"],linestyle=datas["linestyle"])
        elif datas["type"] == "scatter":
            ax.scatter(datas["x"],datas["y"],marker=datas["marker"],color=datas["color"],label=datas["label"])
        else:
            warnings.warn("wrong type")

    if xscale_log:
        ax.set_xscale("log")
    if yscale_log:
        ax.set_yscale("log")

    plt.xlabel(xlabel)
    plt.ylabel(ylabel)
    if legend:
        plt.legend()
    xmax, ymax, xmin, ymin = range["xmax"], range["ymax"], range["xmin"], range["ymin"]
    plt.xlim(xmin,xmax)
    plt.ylim(ymin,ymax)
    if grid:
        ax.grid(True)
        if not xscale_log:
            ax.xaxis.set_major_locator(MultipleLocator((xmax-xmin)/5))
            ax.xaxis.set_minor_locator(MultipleLocator((xmax-xmin)/25))
        if not yscale_log:
            ax.yaxis.set_major_locator(MultipleLocator((ymax-ymin)/5))
            ax.yaxis.set_minor_locator(MultipleLocator((ymax-ymin)/25))
            ax.yaxis.set_major_formatter(ScalarFormatter(useMathText=True))

    if show:
        plt.show()
    fileName += ".jpg"
    plt.savefig(fileName,format="jpg",dpi=dpi)
    print(f"saved as {fileName}")
ExcelとかNumbersを使えばいいじゃんてコメントは受け付けていません
一応これで以下に対応しています。
- 散布図
- 折れ線グラフ
- 折れ線グラフ(エラーバー)
それ以外に関しては私は使わないので作ってください。
一応、軽く解説します。
解説
tick.direction
まずこのような部分が6,7行目にあります。
plt.rcParams["xtick.direction"] = "in"
plt.rcParams["ytick.direction"] = "in"
これはグラフの目盛りの向く方向をグラフのボックス側に向けるということです。数値を読み取る際により判別しやすいというメリットがあります。
グラフ描画部分
    for datas in graphs:
        if datas["type"] == "errory":
            ax.errorbar(datas["x"],datas["y"],yerr=datas["yerr"],marker=datas["marker"],color=datas["color"],label=datas["label"],capsize=capsize,linestyle=datas["linestyle"])
        elif datas["type"] == "errorx":
            ax.errorbar(datas["x"],datas["y"],xerr=datas["xerr"],marker=datas["marker"],color=datas["color"],label=datas["label"],capsize=capsize,linestyle=datas["linestyle"])
        elif datas["type"] == "errorxy":
            ax.errorbar(datas["x"],datas["y"],xerr=datas["xerr"],yerr=datas["yerr"],marker=datas["marker"],color=datas["color"],label=datas["label"],capsize=capsize,linestyle=datas["linestyle"])
        elif datas["type"] == "plot":
            ax.plot(datas["x"],datas["y"],marker=datas["marker"],color=datas["color"],label=datas["label"],linestyle=datas["linestyle"])
        elif datas["type"] == "scatter":
            ax.scatter(datas["x"],datas["y"],marker=datas["marker"],color=datas["color"],label=datas["label"])
        else:
            warnings.warn("wrong type")
ここでグラフを描画しています。先程言っていたグラフの種類を指定することができます。一応グラフはこんな感じで書けば動くようにしています。
[{"type":"errory","x":[0,1,2],"y":[0,1,2],"xerr":[0.1,0.1,0.1],"yerr":[0.2,0.3,0.2],"marker":".","color":"tomato","label":"hoge"}]
- type
- グラフの種類を指定します。
- x
- x軸の値です。y軸と対応するように書くことで使用できます。
- y
- y軸の値です。上と同じです。
- xerr
- x軸にエラーバーを指定した際に使用されます。
- yerr
- y軸にエラーバーを指定した際に使用されます。
- marker
- マーカーの形状を指定します。形はmatplotlibのコマンドに対応しています。
- color
- マーカーや線の色です。
- label
- この数値の凡例です。
- linestyle
- 線の形状を決めます。
対数表示
    if xscale_log:
        ax.set_xscale("log")
    if yscale_log:
        ax.set_yscale("log")
対数表示が必要になったタイミングがまだなかったため突貫ですが、このコマンドによって対数グラフに変更することができます。
ラベル、凡例
    plt.xlabel(xlabel)
    plt.ylabel(ylabel)
    if legend:
        plt.legend()
labelでラベルの作成と、legendで凡例の追加を行っています。また、ラベルに上付き文字や下付き文字を入れることも可能で"$"で囲むことでTeX形式が使用できます。
ただし、これで囲むと斜体も兼ねているため、変数であると思われる可能性があることは注意が必要です。
グリッド調整
    xmax, ymax, xmin, ymin = range["xmax"], range["ymax"], range["xmin"], range["ymin"]
    plt.xlim(xmin,xmax)
    plt.ylim(ymin,ymax)
    if grid:
        ax.grid(True)
        if not xscale_log:
            ax.xaxis.set_major_locator(MultipleLocator((xmax-xmin)/5))
            ax.xaxis.set_minor_locator(MultipleLocator((xmax-xmin)/25))
        if not yscale_log:
            ax.yaxis.set_major_locator(MultipleLocator((ymax-ymin)/5))
            ax.yaxis.set_minor_locator(MultipleLocator((ymax-ymin)/25))
            ax.yaxis.set_major_formatter(ScalarFormatter(useMathText=True))
limを使うことでレンジを指定することができるため、ここで指定しています。
また、下のif grid以降の部分では軸に大きなポイントを5点、小さいポイントを5点入れるように作成しています。これを行っている理由としては、判読を容易にする目的があります。
5分割すれば一区間の計算が範囲の桁を一桁落として2倍すれば求めることができるため、判読しやすいという利点があると考えています。同様の理由で小さいポイントも5点入れています。
表示と保存
    if show:
        plt.show()
    fileName += ".jpg"
    plt.savefig(fileName,format="jpg",dpi=dpi)
    print(f"saved as {fileName}")
plt.showで見えるようにもできます。ただ、これによって一時停止されるというデメリットとipynbとかを使えば自動で出るのでいらないと思います。
そして、filenameに拡張子を加えた名前で保存します。dpiは印刷物を想定して300としていますが、画面で出すものではクソデカなので下げてもいいと思います。
実際に動かしたやつ
コード
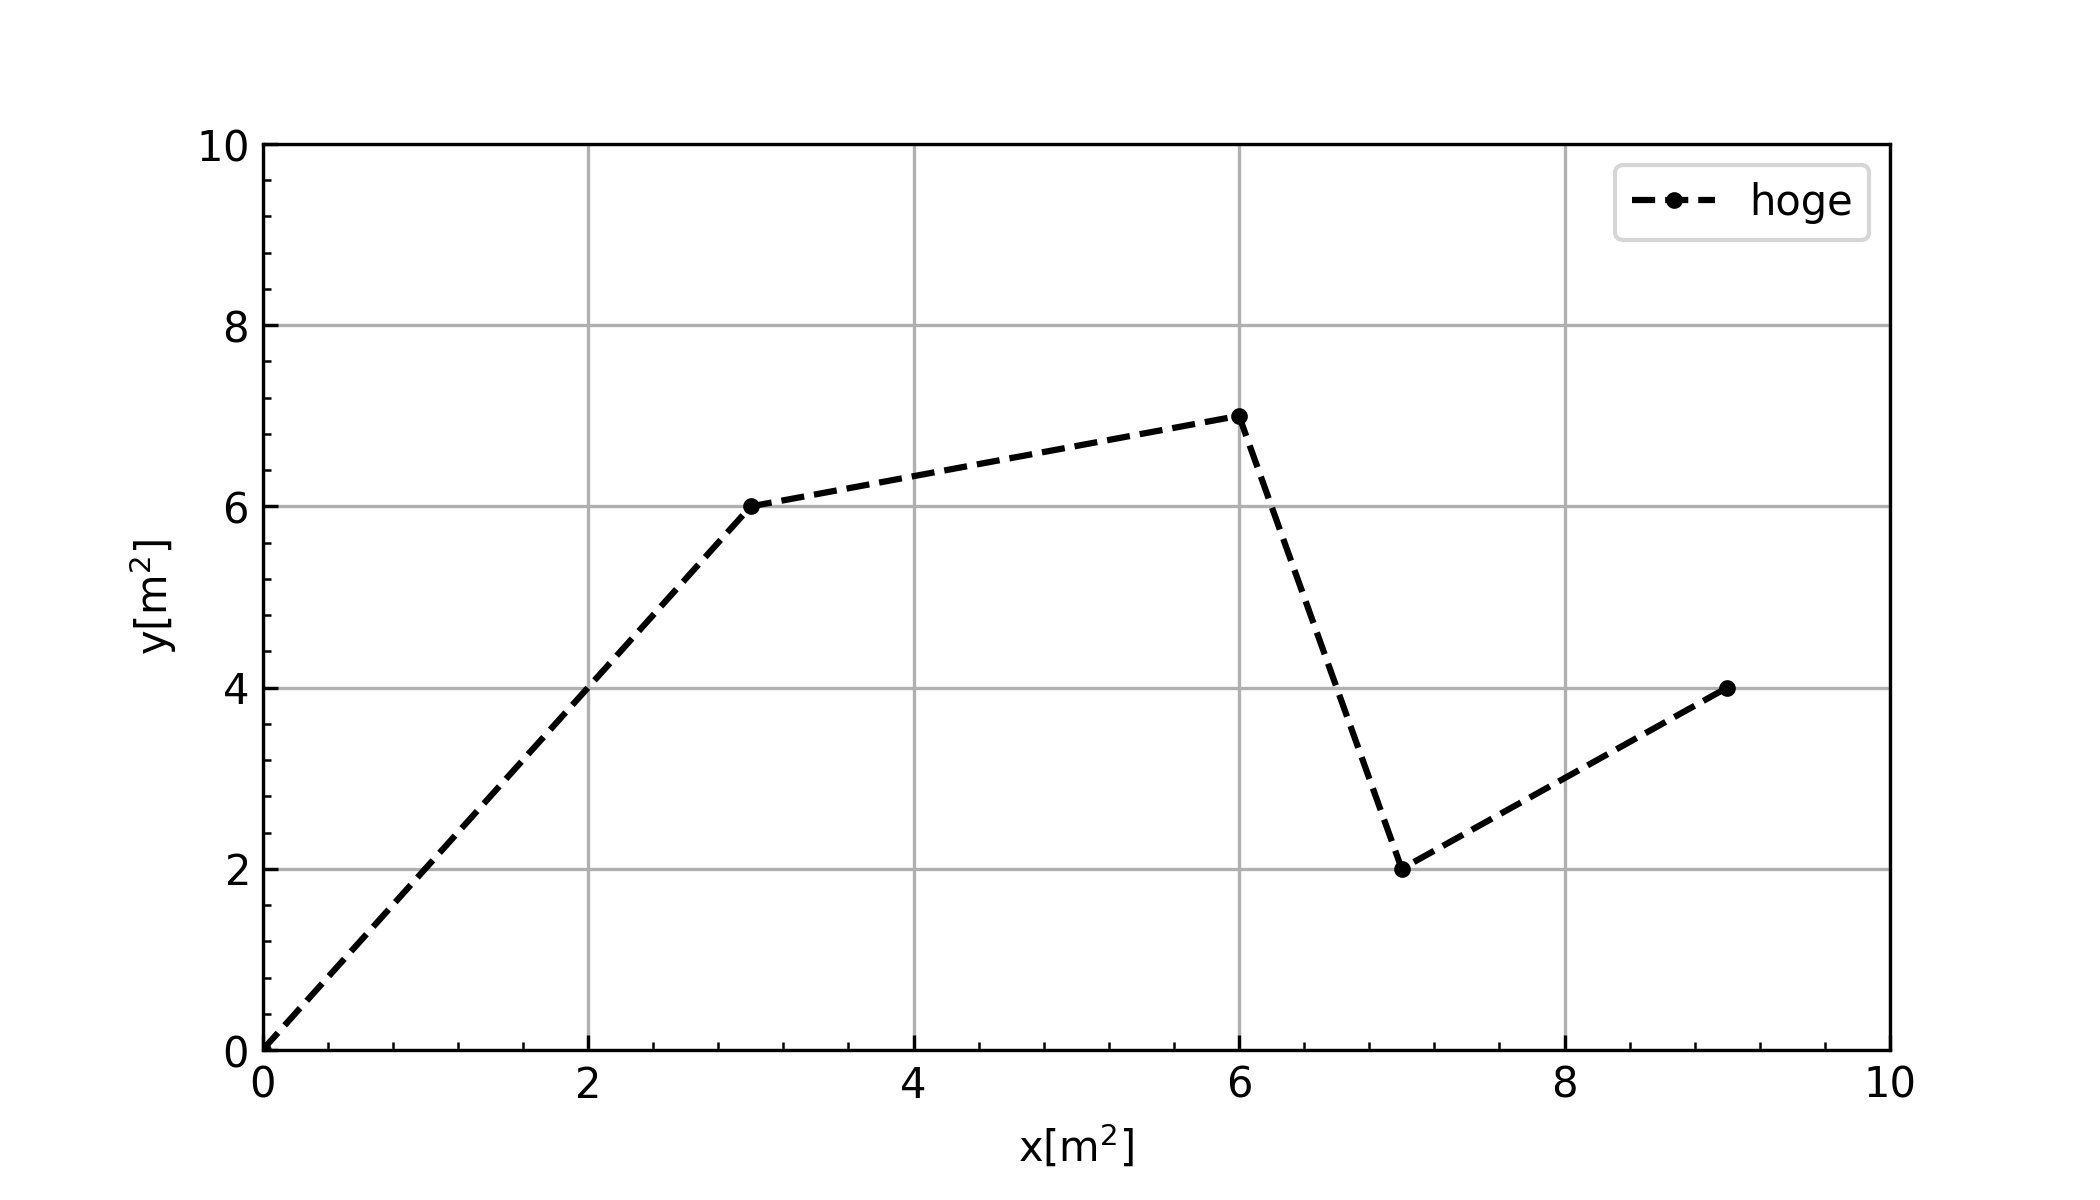
graph = [{"type":"plot","x":[0,3,6,7,9],"y":[0,6,7,2,4],"xerr":[0.1,0.1,0.1,0.1,0.1],"yerr":[0.2,0.3,0.2,0.1,0.1],"marker":".","color":"black","label":"hoge","linestyle":"dashed"}]
ranges = {"xmax": 10,"ymax":10, "xmin":0, "ymin":0}
make_graph(graph, "x[m$^2$]", "y[m$^2$]", ranges, "test")
結果グラフ
ということで完成しました。これをライブラリとかにしておけば呼び出しとかも簡単になるのでおすすめです。
