初めに
matplotlibはすごく便利です。numpyもすごく便利です。つまりpythonは便利ということです。以上です。
プログラム
機械学習のデータとしてsin波を用意したため、それをとりあえず何となく可視化しようとしたのが以下のプログラムです。
import numpy as np
import matplotlib.pyplot as plt
# -4.0 ~ 4.0
xs = np.arange(-400,400)*0.01
# shuffle
np.random.shuffle(xs)
splitPoint = int(len(xs)*0.9)
# training and test inputs
xsTrain = xs[:splitPoint]
xsTest = xs[splitPoint:]
# trainin and test golds
tsTrain = np.sin(xsTrain)
tsTest = np.sin(xsTest)
# plot
plt.plot(xsTrain,tsTrain)
plt.show()
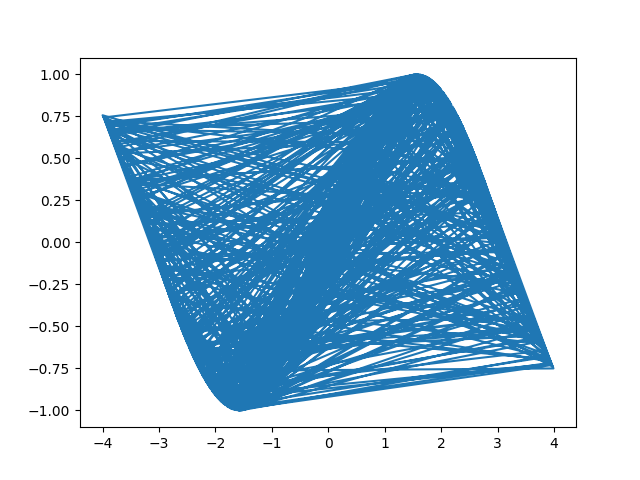
なんか綺麗なのが出てきてしまった。しかしsin波ではないので、プロット取り直して再走しましょう。
というか、どうしてこんな風になってるんだ…?
因みに
xsTrainとtsTrainがどんなデータかということですが
print(xsTrain)
[ 3.01  2.54  1.99  2.91 -3.93  3.08  1.19 -1.92  1.68  2.42  2.43  1.16

......

 -2.06 -3.37  3.38  1.39 -1.83 -0.76  0.17 -3.16  3.78  2.28 -2.29  2.74]

print(tsTrain)
[ 0.13121319  0.56595623  0.91341336  0.22952795  0.70923139  0.06155372

......

  0.16918235  0.01840631 -0.59591722  0.75888071 -0.75233058  0.39088478]

print(type(xsTrain))
<class numpy.ndarray>
print(type(tsTrain))
<class numpy.ndarray>

print(len(xsTrain))
720
print(len(tsTrain))
720
結構大きいので「....」で省略させてもらってます。
簡単な解決策
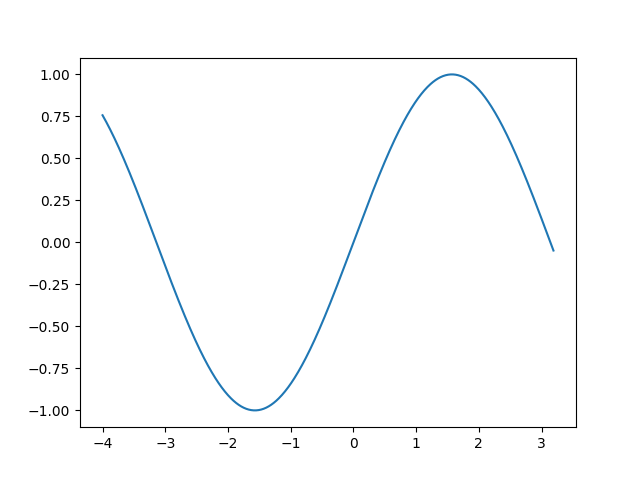
先程の画像をよく見てみれば、sin波自体は出ているみたいです。sin波があるかな?と見てみれば分かるでしょう。つまり、考えれる可能性は線のとり方が下手だったということでしょう。
sin波のデータとして参考にしようとしたサイトでは、シャッフルしていたので、シャッフルをしたままプロットしているわけですが、プロットするにはソートしておく必要があるみたいです。
つまりとりあえずの解決策としては、シャッフルをしないということでしょうか。
import numpy as np
import matplotlib.pyplot as plt
# -4.0 ~ 4.0
xs = np.arange(-400,400)*0.01
splitPoint = int(len(xs)*0.9)
# training and test inputs
xsTrain = xs[:splitPoint]
xsTest = xs[splitPoint:]
# trainin and test golds
tsTrain = np.sin(xsTrain)
tsTest = np.sin(xsTest)
# plot
plt.plot(xsTrain,tsTrain)
plt.show()
もっと完璧な解決策
線を書くのが不味いのであれば、線を書かず点だけをプロットするようなメソッドを使えばいいではないですか。というわけで調べてみれば、さすがmatplotlib、普通にあるみたいです。
scatterというメソッド
import numpy as np
import matplotlib.pyplot as plt
# -4.0 ~ 4.0
xs = np.arange(-400,400)*0.01
# shuffle
np.random.shuffle(xs)
splitPoint = int(len(xs)*0.9)
# training and test inputs
xsTrain = xs[:splitPoint]
xsTest = xs[splitPoint:]
# trainin and test golds
tsTrain = np.sin(xsTrain)
tsTest = np.sin(xsTest)
# plot
plt.scatter(xsTrain,tsTrain)
plt.show()
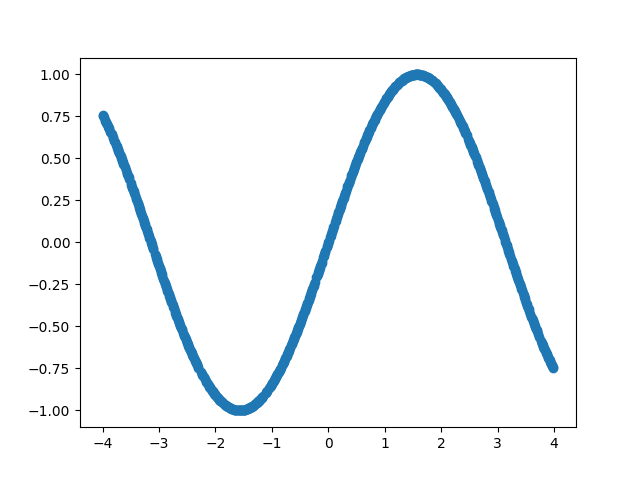
点の描画であるため太めの線のように見えますね。たしか線の太さとか点の太さとかを変えることも出来たな、と思い出しましたがめんどくさいのでとりあえずこのままです。
最後に
今回オレが学ぶべき教訓は、matplotlibは用意された要素が点を作り、その順番ごとに線が生成されるということだろう。
ちょっと備忘録でした〜。