Azure AI Foundry Agent Service の実行および評価をでトレースと監視できるようにしてみました。
Risk&Safetyは出力していません。
基本的にはこの記事のAgent版なので、重複している内容の解説は省略します。
前提
- Log Analytics Workspaceのリソース作成済
- Application insightsのリソース作成済
- Azure AI Foundreyのリソース作成し、モデルもデプロイ済
Step
1. Application Insights のリソース接続
Azure AI Foundry画面のメニュー「監視」を開いて、「アプリケーション分析」タブからリソース接続実施

2. プログラム作成
プログラム環境
| 種類 | Version | 備考 |
|---|---|---|
| OS | Ubuntu22.04.5 LTS | WSL2で動かしています |
| Python | 3.13.2 | |
| Poetry | 2.1.3 | 仮想環境の管理に使用 |
Python パッケージ
| 種類 | Version | 備考 |
|---|---|---|
| azure-monitor-opentelemetry | 1.6.11 | |
| azure-ai-projects | 1.0.0b12 | |
| opentelemetry-instrumentation-openai-v2 | 2.1b0 | |
| openai | 1.97.0 |
プログラム全体
まずはプログラム全体です。
import os
from logging import Formatter

from azure.ai.agents.models import ListSortOrder
from azure.ai.projects import AIProjectClient
from azure.ai.projects.models import AgentEvaluationRequest, AgentEvaluationRedactionConfiguration, EvaluatorIds
from azure.identity import DefaultAzureCredential
from azure.monitor.opentelemetry import configure_azure_monitor
from opentelemetry import trace

os.environ["OTEL_RESOURCE_ATTRIBUTES"]="service.namespace=my-namespace,service.instance.id=my-instance"
os.environ["OTEL_SERVICE_NAME"]="テストAgentアプリ"
os.environ["AZURE_TRACING_GEN_AI_CONTENT_RECORDING_ENABLED"] = "true" # False by default

project_client = AIProjectClient(
    credential=DefaultAzureCredential(),
    endpoint="https://<your-resource>.services.ai.azure.com/api/projects/<your-project>",
)

connection_string = project_client.telemetry.get_connection_string()

configure_azure_monitor(connection_string=connection_string,
                        logging_formatter=Formatter("%(asctime)s - %(name)s - %(levelname)s - %(message)s")
)

tracer = trace.get_tracer(__name__)

with tracer.start_as_current_span("agent-span"):
    agent = project_client.agents.create_agent(
        model="gpt-4o-mini",
        name="my-assistant",
        instructions="You are a helpful assistant"
    )
    #thread = project_client.agents.create_thread()
    thread = project_client.agents.threads.create()
    message = project_client.agents.messages.create(
        thread_id=thread.id, role="user", content="Tell me a joke"
    )
    run = project_client.agents.runs.create_and_process(
        thread_id=thread.id,
        agent_id=agent.id
    )
    if run.status == "failed":
        print(f"Run failed: {run.last_error}")
    else:
        messages = project_client.agents.messages.list(thread_id=thread.id, order=ListSortOrder.ASCENDING)

        for message in messages:
            if message.text_messages:
                print(f"{message.role}: {message.text_messages[-1].text.value}")

evaluators = {
    "Relevance": {"Id": EvaluatorIds.Relevance.value},
    "Fluency": {"Id": EvaluatorIds.Fluency.value},
    "Coherence": {"Id": EvaluatorIds.Coherence.value},
}

project_client.evaluations.create_agent_evaluation(
    AgentEvaluationRequest(
        thread_id=thread.id,
        run_id=run.id,
        evaluators=evaluators,
        redaction_configuration=AgentEvaluationRedactionConfiguration(
            redact_score_properties=False,
       ),
        app_insights_connection_string=project_client.telemetry.get_connection_string(),
    )
)
詳細抜粋内容
部分的に解説します。
環境変数設定
面倒だったのでPyenv使わずに直接設定。
AZURE_TRACING_GEN_AI_CONTENT_RECORDING_ENABLEDをtrueにすることこでチャット内容をトレースします。
os.environ["OTEL_RESOURCE_ATTRIBUTES"]="service.namespace=my-namespace,service.instance.id=my-instance"
os.environ["OTEL_SERVICE_NAME"]="テストAgentアプリ"
os.environ["AZURE_TRACING_GEN_AI_CONTENT_RECORDING_ENABLED"] = "true" # False by default
Agent実行系
Agent実行部分の監視とトレースをします。
tracerを取得して、spanを作るだけなので簡単です。
tracer = trace.get_tracer(__name__)

with tracer.start_as_current_span("agent-span"):
    agent = project_client.agents.create_agent(
        model="gpt-4o-mini",
        name="my-assistant",
        instructions="You are a helpful assistant"
    )
    #thread = project_client.agents.create_thread()
    thread = project_client.agents.threads.create()
    message = project_client.agents.messages.create(
        thread_id=thread.id, role="user", content="Tell me a joke"
    )
    run = project_client.agents.runs.create_and_process(
        thread_id=thread.id,
        agent_id=agent.id
    )
    if run.status == "failed":
        print(f"Run failed: {run.last_error}")
    else:
        messages = project_client.agents.messages.list(thread_id=thread.id, order=ListSortOrder.ASCENDING)

        for message in messages:
            if message.text_messages:
                print(f"{message.role}: {message.text_messages[-1].text.value}")
監視の設定
接続文字列を取得して監視設定。loggingのformatterは設定しないとエラー起きたので設定しています。前に試した時は不要だったので、バージョンに依存しているかもしれません。
connection_string = project_client.telemetry.get_connection_string()
configure_azure_monitor(connection_string=connection_string,
                        logging_formatter=Formatter("%(asctime)s - %(name)s - %(levelname)s - %(message)s")
)
評価実行
evaluatorを定義して、先ほどのthread id と run id を指定して評価します。redaction_configurationを指定することで評価理由も出力します。
evaluators = {
    "Relevance": {"Id": EvaluatorIds.Relevance.value},
    "Fluency": {"Id": EvaluatorIds.Fluency.value},
    "Coherence": {"Id": EvaluatorIds.Coherence.value},
}

project_client.evaluations.create_agent_evaluation(
    AgentEvaluationRequest(
        thread_id=thread.id,
        run_id=run.id,
        evaluators=evaluators,
        redaction_configuration=AgentEvaluationRedactionConfiguration(
            redact_score_properties=False,
       ),
        app_insights_connection_string=project_client.telemetry.get_connection_string(),
    )
)
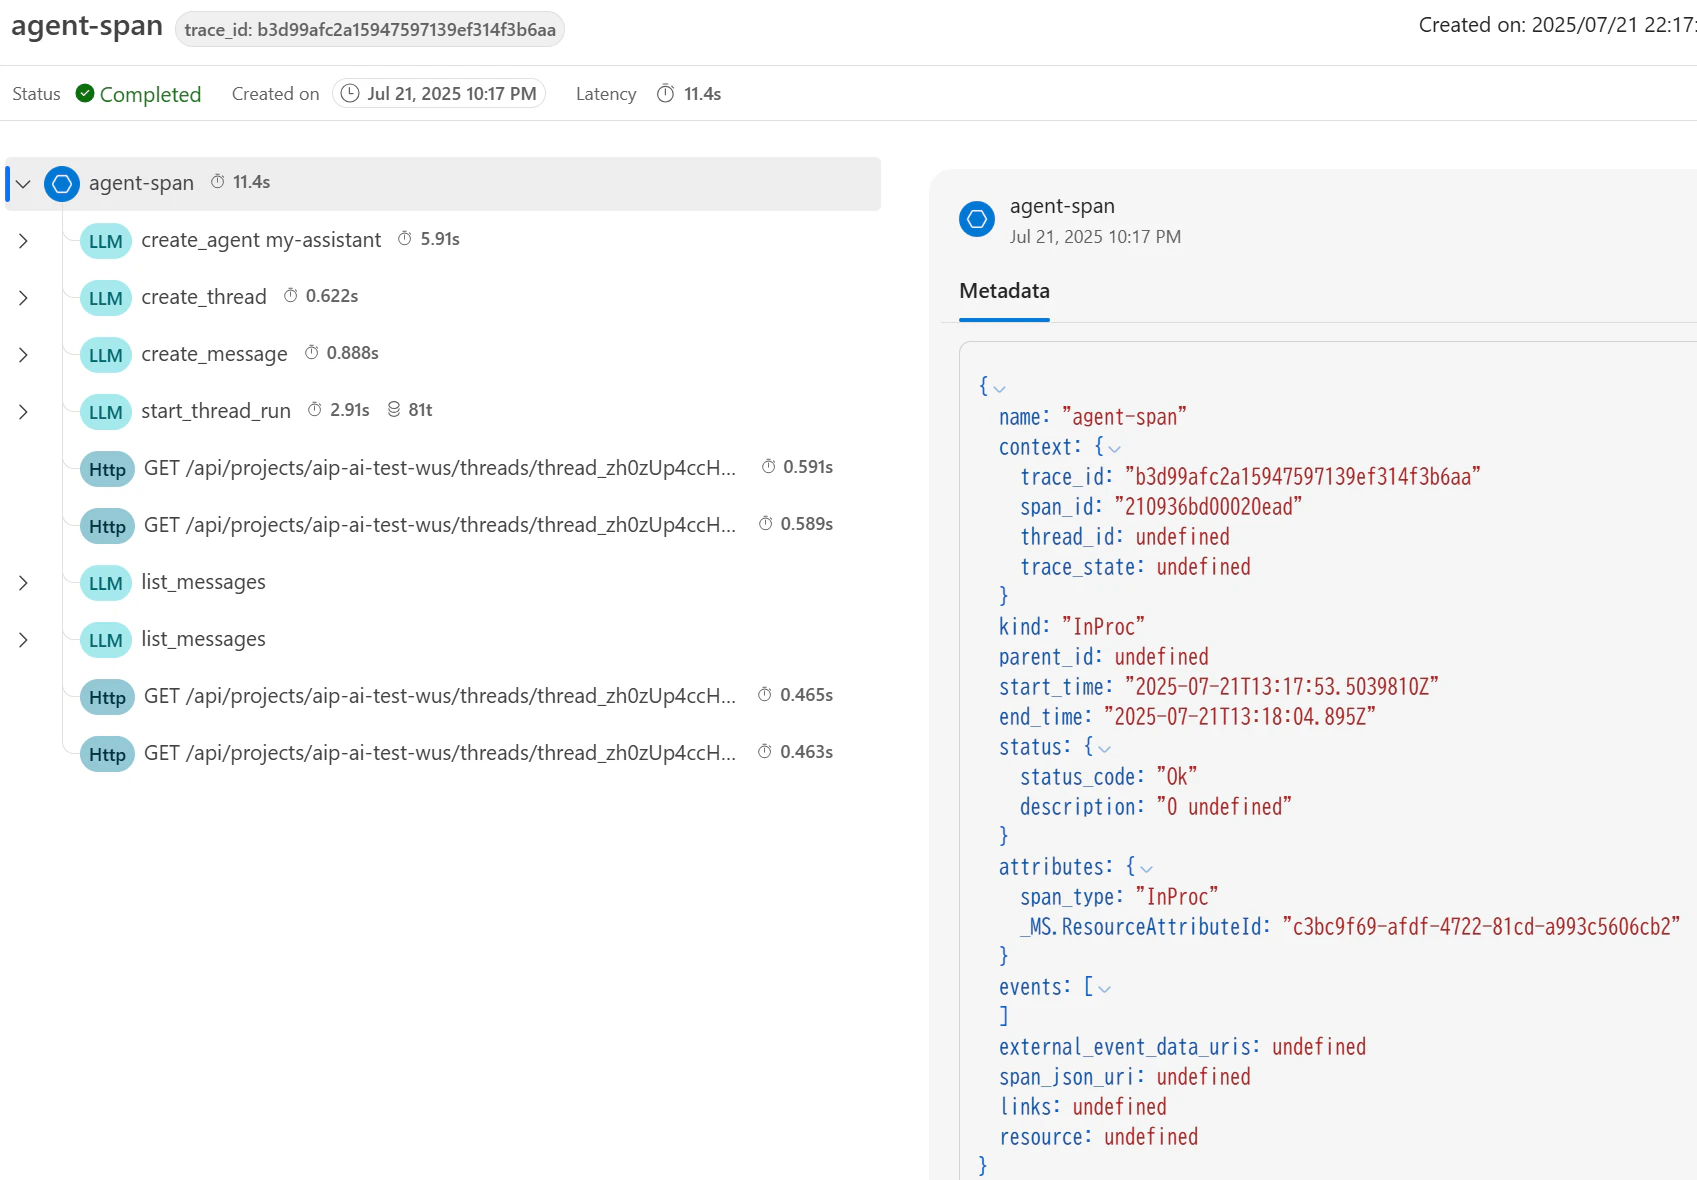
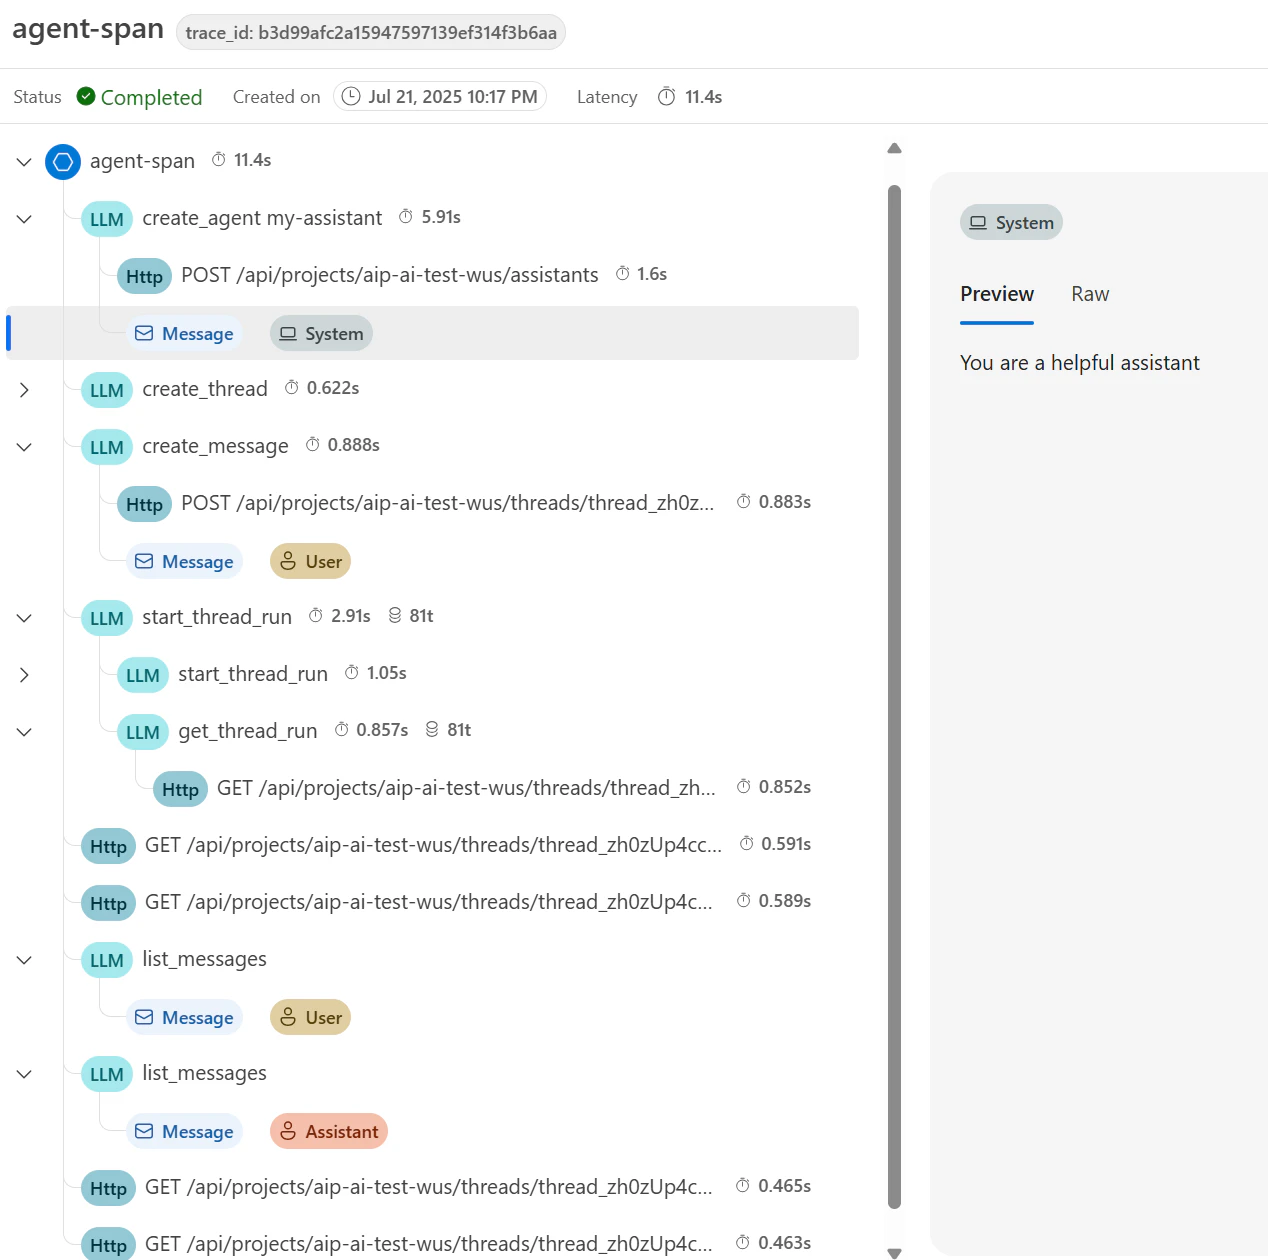
トレース画面
Agent実行部分
spanで指定したAgent実行部分です。Agent作成から初めて list_message も含めて出ています。
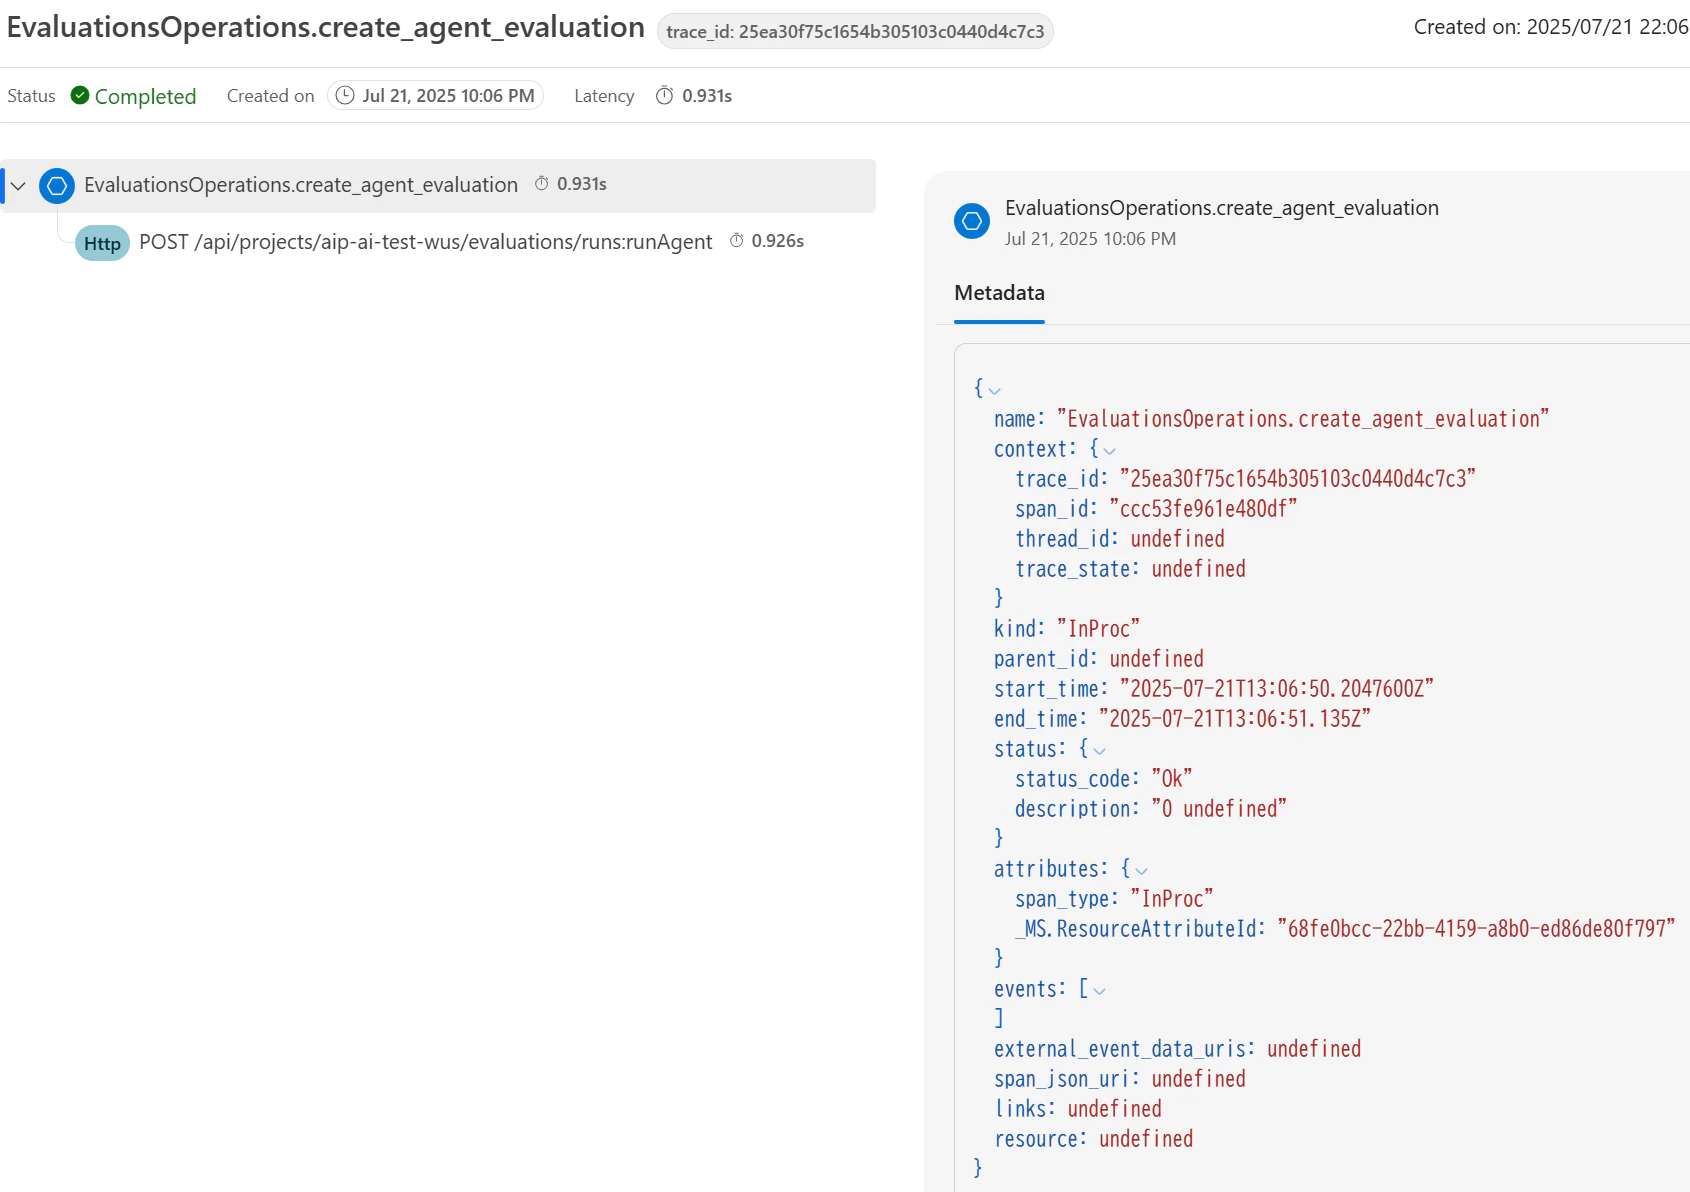
評価実行部分
評価実行の指示を飛ばしているだけで、評価結果はトレース画面からは見えないです。
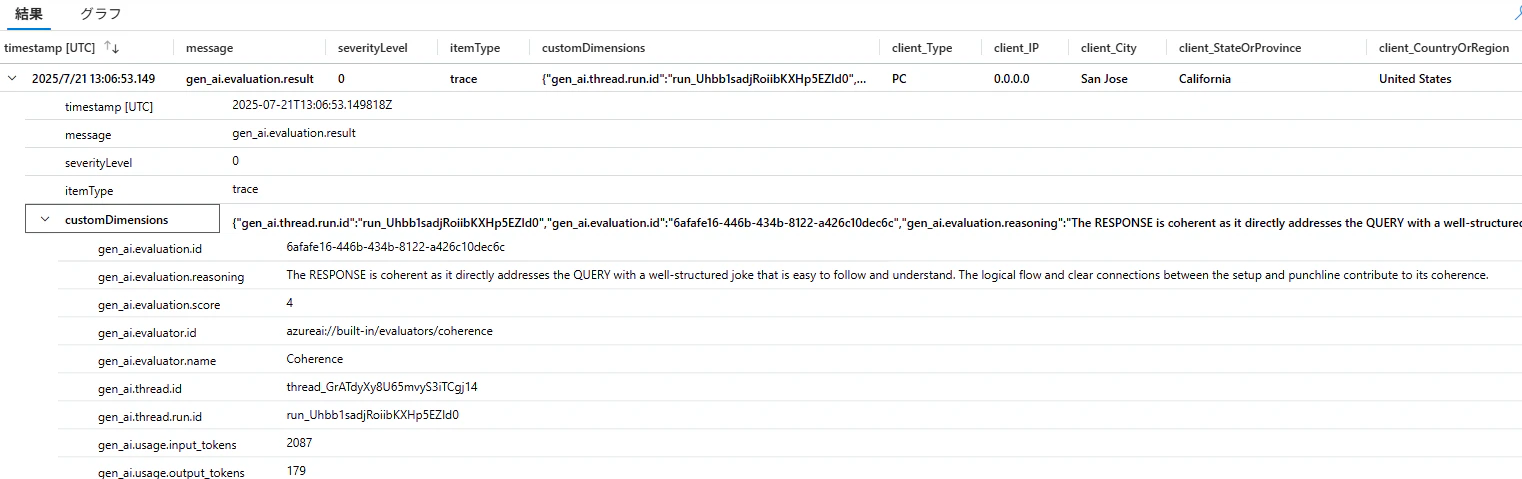
Application Insights から見ると、こんな風にログが溜まっています。
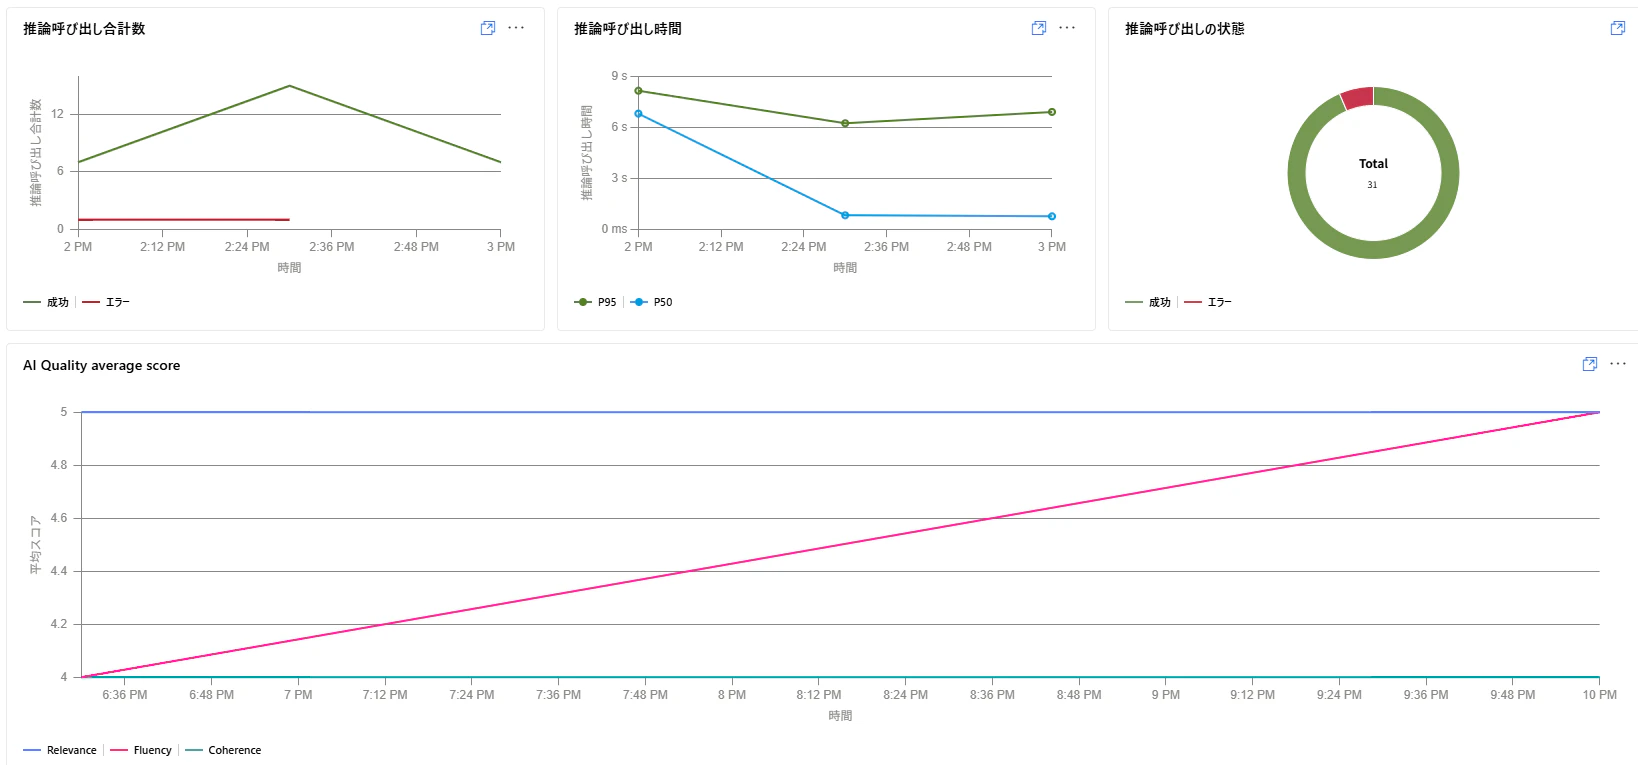
監視画面
こんな風に見ることができます。ただ、多くのメトリックでAgentの実行結果は反映されていない気がします(画面に出ているのは、Agent実行以外の内容)。
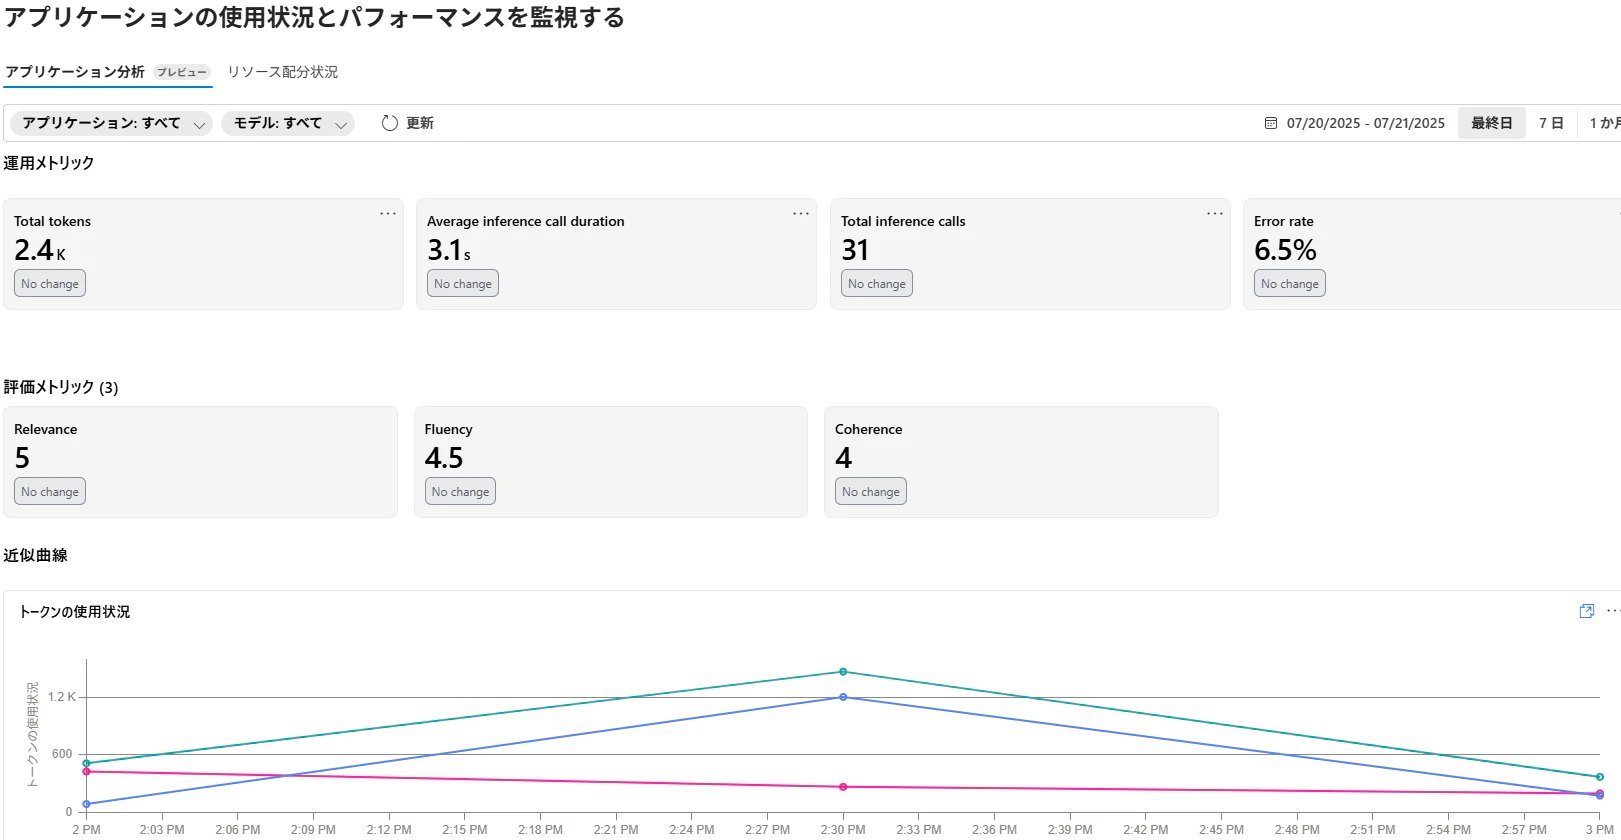
例えば、「トークンの使用状況」のグラフで「Open query link」をクリックしてクエリ内容を確認します。
set query_take_max_records=10001;
set truncationmaxsize=67108864;
let application = dynamic(['*']);
let model = dynamic(['*']);
let get_model = (customDimensions: dynamic) { iff(customDimensions["gen_ai.request.model"] == "", customDimensions["gen_ai.response.model"], customDimensions["gen_ai.request.model"]) };
let is_inference_call = (customDimensions: dynamic) {
    // this filters out non-genai calls/non-inference calls like create_agent
    customDimensions["gen_ai.system"] != "" and customDimensions["gen_ai.operation.name"] in ("chat", "process_thread_run", "text_completion")
};
let filter_inference_model_and_app = (customDimensions: dynamic, app_name: string) {
    is_inference_call(customDimensions) == true and
    ("*" in (model) or array_length(model) == 0 or get_model(customDimensions) in (model)) and
    ('*' in (application) or array_length(application) == 0 or app_name in (application))
};
dependencies
| where timestamp between(datetime("2025-07-20T13:33:51.400Z") .. datetime("2025-07-21T13:33:51.400Z"))
| where filter_inference_model_and_app(customDimensions, cloud_RoleName) == true
| summarize
    Prompt_Tokens = sum(toint(customDimensions["gen_ai.usage.input_tokens"])),
    Completion_Tokens = sum(toint(customDimensions["gen_ai.usage.output_tokens"])),
    Total_Tokens = sum(toint(customDimensions["gen_ai.usage.input_tokens"]) + toint(customDimensions["gen_ai.usage.output_tokens"]))
    by bin(timestamp, 30m)
customDimensions["gen_ai.operation.name"] in ("chat", "process_thread_run", "text_completion")};となっている部分に"start_thread_run"が足りないです。
Application InsightsのBookで確認してみます。メニューの 監視 -> ブック から「AI Foundry ダッシュボード」を開き、編集していきます。
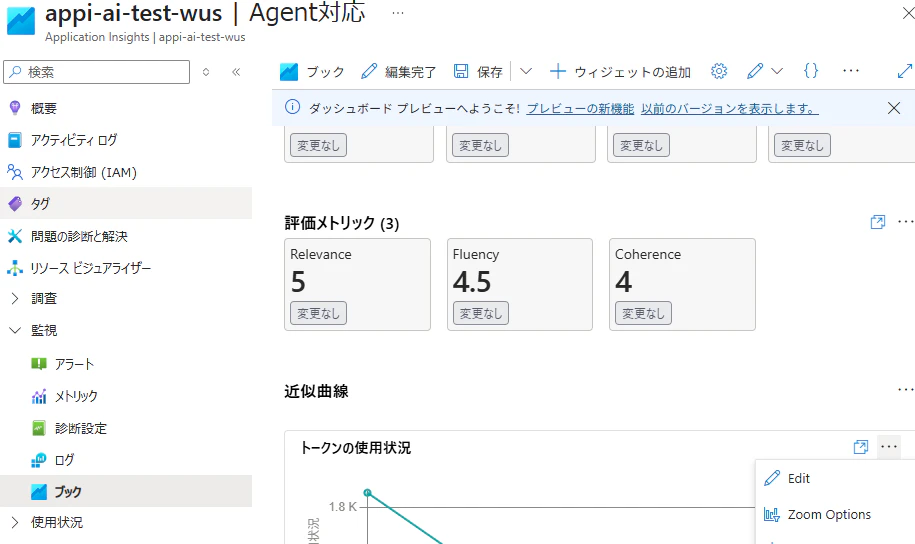
「トークンの使用状況」のグラフでcustomDimensions["gen_ai.operation.name"] in ("chat", "start_thread_run", "process_thread_run", "text_completion")};に変更することで、Agentのログも見えました。多分、他も同じような変更するとAngetの実行内容を追加できると思います。
追記
プログラム上でのStepの見方
run_stepsというオブジェクトを内部的に持っています。
全然別のプログラムからですが、以下のようにして見ることができます。
run_steps = project_client.agents.run_steps.list(thread_id=run.thread_id, run_id=run.id)
for step in run_steps:
    print(step)
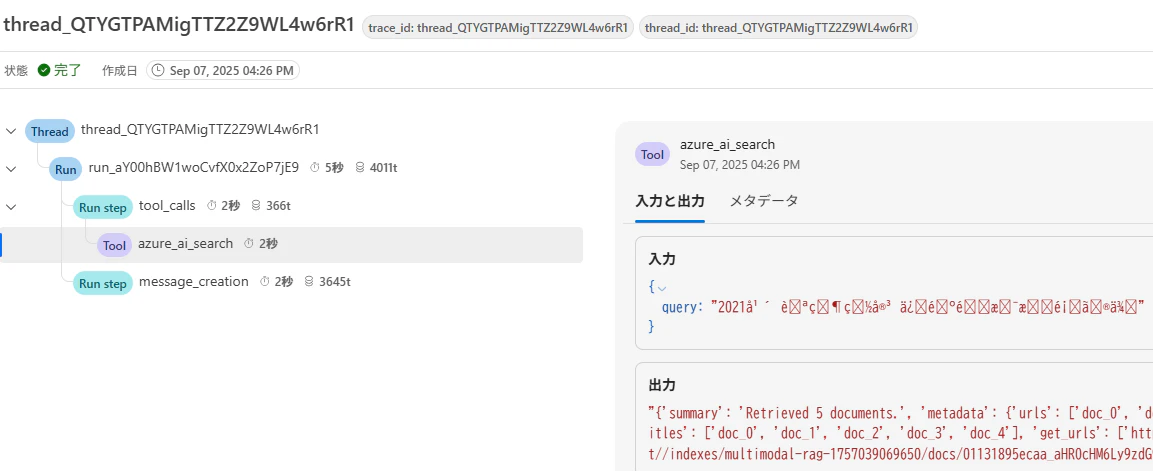
2行目はAzure AI Searchをナレッジにしていて、呼び出している箇所です。
// 1行目(1 Step目)
{
    "id": "step_w2b6qFIqeWjqFNwCEF2kprOz",
    "object": "thread.run.step",
    "created_at": 1757229077,
    "run_id": "run_MzsGn2amlD8z7KppcY6anZb5",
    "assistant_id": "asst_6yVyZMhNr9nMaVRx2wMsLWgw",
    "thread_id": "thread_VQUsAdQSXLmkv0YJBR9v65dc",
    "type": "message_creation",
    "status": "completed",
    "cancelled_at": None,
    "completed_at": 1757229079,
    "expires_at": None,
    "failed_at": None,
    "last_error": None,
    "step_details": {
        "type": "message_creation",
        "message_creation": {"message_id": "msg_RFwkgCAIyeb8kE1TZXAM9tzv"},
    },
    "usage": {
        "prompt_tokens": 3396,
        "completion_tokens": 268,
        "total_tokens": 3664,
        "prompt_token_details": {"cached_tokens": 0},
    },
}

2行目(2 Step目)
{
    "id": "step_v7FE0impKA9cszAqqHdp3Xpu",
    "object": "thread.run.step",
    "created_at": 1757229075,
    "run_id": "run_MzsGn2amlD8z7KppcY6anZb5",
    "assistant_id": "asst_6yVyZMhNr9nMaVRx2wMsLWgw",
    "thread_id": "thread_VQUsAdQSXLmkv0YJBR9v65dc",
    "type": "tool_calls",
    "status": "completed",
    "cancelled_at": None,
    "completed_at": 1757229077,
    "expires_at": None,
    "failed_at": None,
    "last_error": None,
    "step_details": {
        "type": "tool_calls",
        "tool_calls": [
            {
                "id": "call_rcIBGsIQ022bSZWxoxxB6zbx",
                "type": "azure_ai_search",
                "azure_ai_search": {
                    "input": '{"query":"2021å¹´ è\x87ªç\x84¶ç\x81½å®³ ä¿\x9dé\x99ºé\x87\x91æ\x94¯æ\x89\x95é¡\x8dã\x81®ä¾\x8b"}',
                    "output": "{'summary': 'Retrieved 5 documents.', 'metadata': {'urls': ['doc_0', 'doc_1', 'doc_2', 'doc_3', 'doc_4'], 'titles': ['doc_0', 'doc_1', 'doc_2', 'doc_3', 'doc_4'], 'get_urls': ['https://.search.windows.net//indexes/multimodal-rag-1757039069650/docs/'省略 ], 'ids': ['01131895ecaa_aHR0cHM6Ly9zdG9yYWdlcmFnanBlLmJsb2IuY29yZS53aW5kb3dzLm5ldC9yYWctZG9jLXRlc3QvMDEucGRm0_text_sections_4', '01131895ecaa_aHR0cHM6Ly9zdG9yYWdlcmFnanBlLmJsb2IuY29yZS53aW5kb3dzLm5ldC9yYWctZG9jLXRlc3QvMDEucGRm0_text_sections_3', '01131895ecaa_aHR0cHM6Ly9zdG9yYWdlcmFnanBlLmJsb2IuY29yZS53aW5kb3dzLm5ldC9yYWctZG9jLXRlc3QvMDEucGRm0_text_sections_5', '01131895ecaa_aHR0cHM6Ly9zdG9yYWdlcmFnanBlLmJsb2IuY29yZS53aW5kb3dzLm5ldC9yYWctZG9jLXRlc3QvMDEucGRm0_text_sections_0', 'f2611d5ffe6d_aHR0cHM6Ly9zdG9yYWdlcmFnanBlLmJsb2IuY29yZS53aW5kb3dzLm5ldC9yYWctZG9jLXRlc3QvMDEucGRm0_normalized_images_5'], 'command': 'search', 'query_type': 'vector_simple_hybrid', 'top_k': 5, 'filter': False}}",
                },
            }
        ],
    },
    "usage": {
        "prompt_tokens": 339,
        "completion_tokens": 27,
        "total_tokens": 366,
        "prompt_token_details": {"cached_tokens": 0},
    },
}
queryが文字化けしていて、こうすると日本語にできました。
print(step.step_details.tool_calls[0].azure_ai_search["input"].encode("latin1").decode("utf-8"))
'{"query":"2021年 自然災害 保険金支払額の例"}'
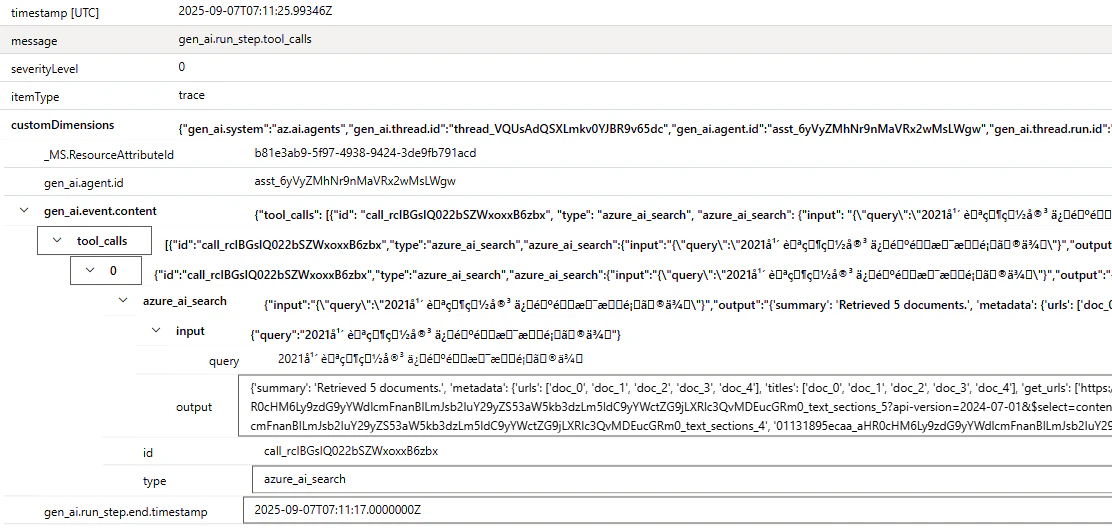
Application Insightsでテーブルtracesを見るとこんな感じで入っています。
エージェントプレイグラウンドからだとこんな風にトレースが見えました(Pythonプログラム実行後にトレースから見た画面ではないです)。