この記事のコードをまとめたものはGithubにあります。
使用するパッケージ
library(tidyverse)
library(magrittr)
折れ線グラフに使いやすい形にデータを整える
data %<>%
  group_by(year, party_jpn) %>% # 年ごと、各政党ごとに処理を行う
  summarise(smd = sum(smd)) %>%  # 各政党の当選者数を計算
  filter(party_jpn %in% c("自民党", "民主党", "公明党", "共産党")) # 政党を絞る
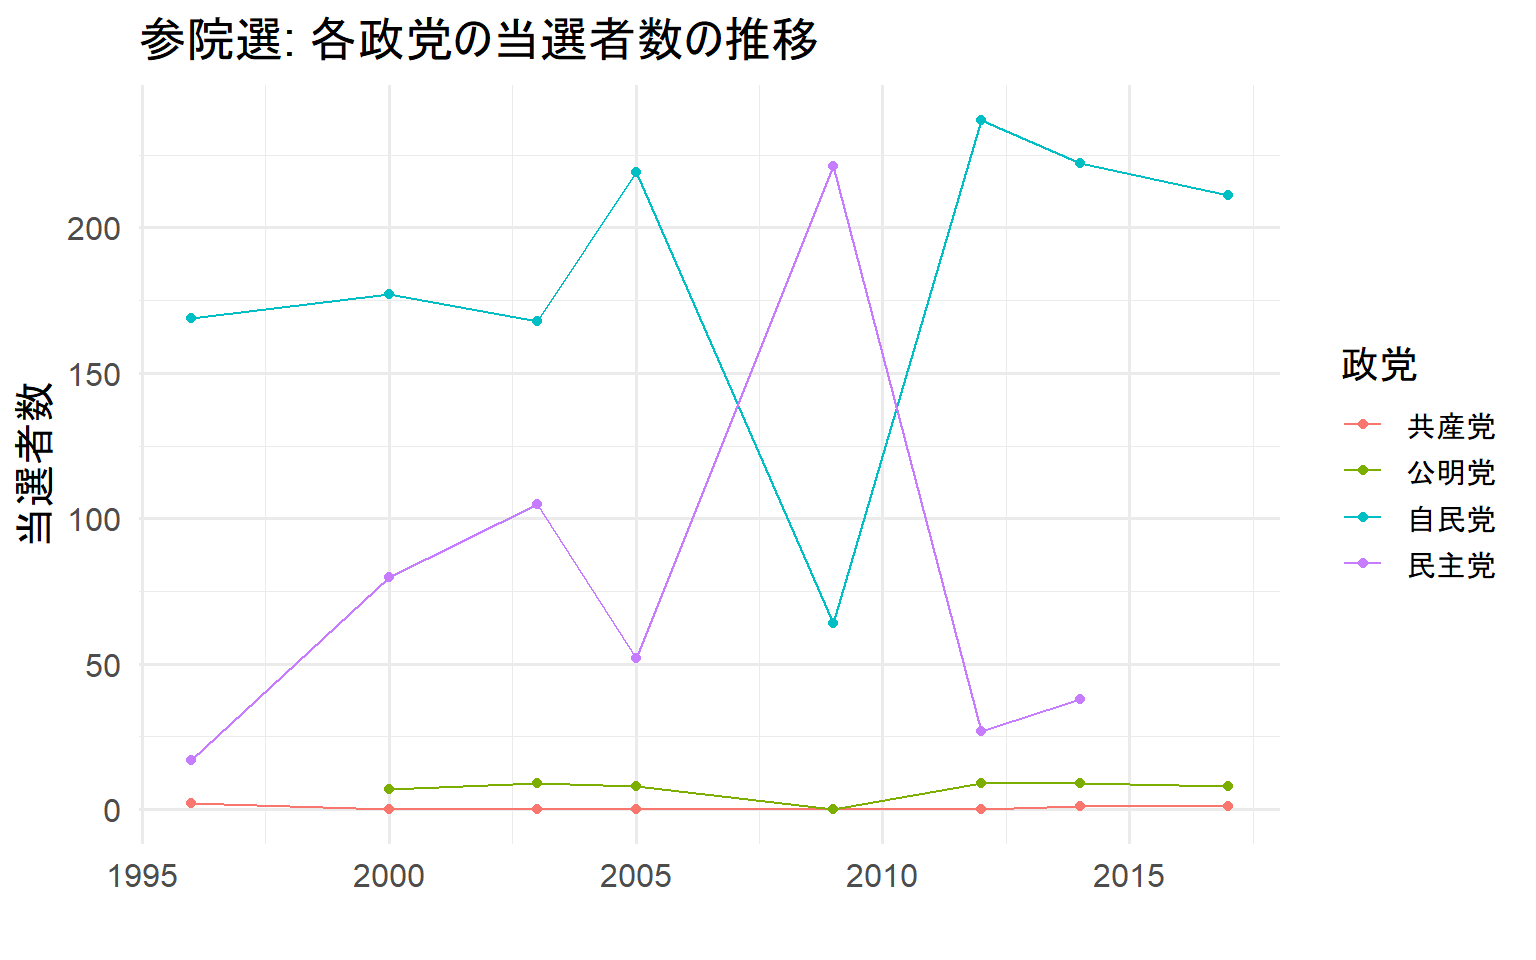
折れ線グラフ
なんの変哲もない折れ線グラフ
data %>%
  ggplot(aes(x = year, y = smd,
             group = party_jpn,
             color = party_jpn)) +
  geom_point() +
  geom_line() +
  labs(x = "", y = "当選者数",
       title = "参院選: 各政党の当選者数の推移",
       color = "政党")
政党ごとにpointの形を変える
線を色ごとに変えたほうが視認性が高いが、モノクロで資料を作らなければならない時もある。
その場合は、pointの形を変えると良い。また、線の形を変えても良いだろう。
個人的にはpointの形を変えたほうが視認性が高いと思う。
ちなみに、pointの形を変える場合はsize =でpointを大きくしたほうが見やすい。
ちなみに、折れ線グラフのlegendはbottomの方が良いという声もある。
legendをbottomにするときはlabs()でx = NULLとしたほうが見栄えが良い。
data %>%
  ggplot(aes(x = year, y = smd,
             group = party_jpn)) +
  geom_point(aes(shape = party_jpn),
             size = 4) +
  geom_line() +
  labs(x = NULL, y = "当選者数",
       title = "参院選: 各政党の当選者数の推移",
       shape = NULL) +
  theme(legend.title = element_blank(),
        legend.position = "bottom")

政党ごとにlineの形を変える
data %>%
  ggplot(aes(x = year, y = smd,
             group = party_jpn)) +
  geom_point() +
  geom_line(aes(linetype = party_jpn)) +
  labs(x = NULL, y = "当選者数",
       title = "参院選: 各政党の当選者数の推移",
       linetype = NULL) +
  theme(legend.position = "bottom")

legendの位置を自由に指定する場合
legendをグラフの中に置いたほうが見やすいという人もいる。
その場合、legend.position = c(x, y)でlegendの位置を指定する。
data %>%
  ggplot(aes(x = year, y = smd,
             group = party_jpn,
             color = party_jpn)) +
  geom_point() +
  geom_line() +
  labs(x = "", y = "当選者数",
       title = "参院選: 各政党の当選者数の推移",
       color = "政党") +
  theme(legend.title = element_blank(),
        legend.position = c(0.1, 0.5))

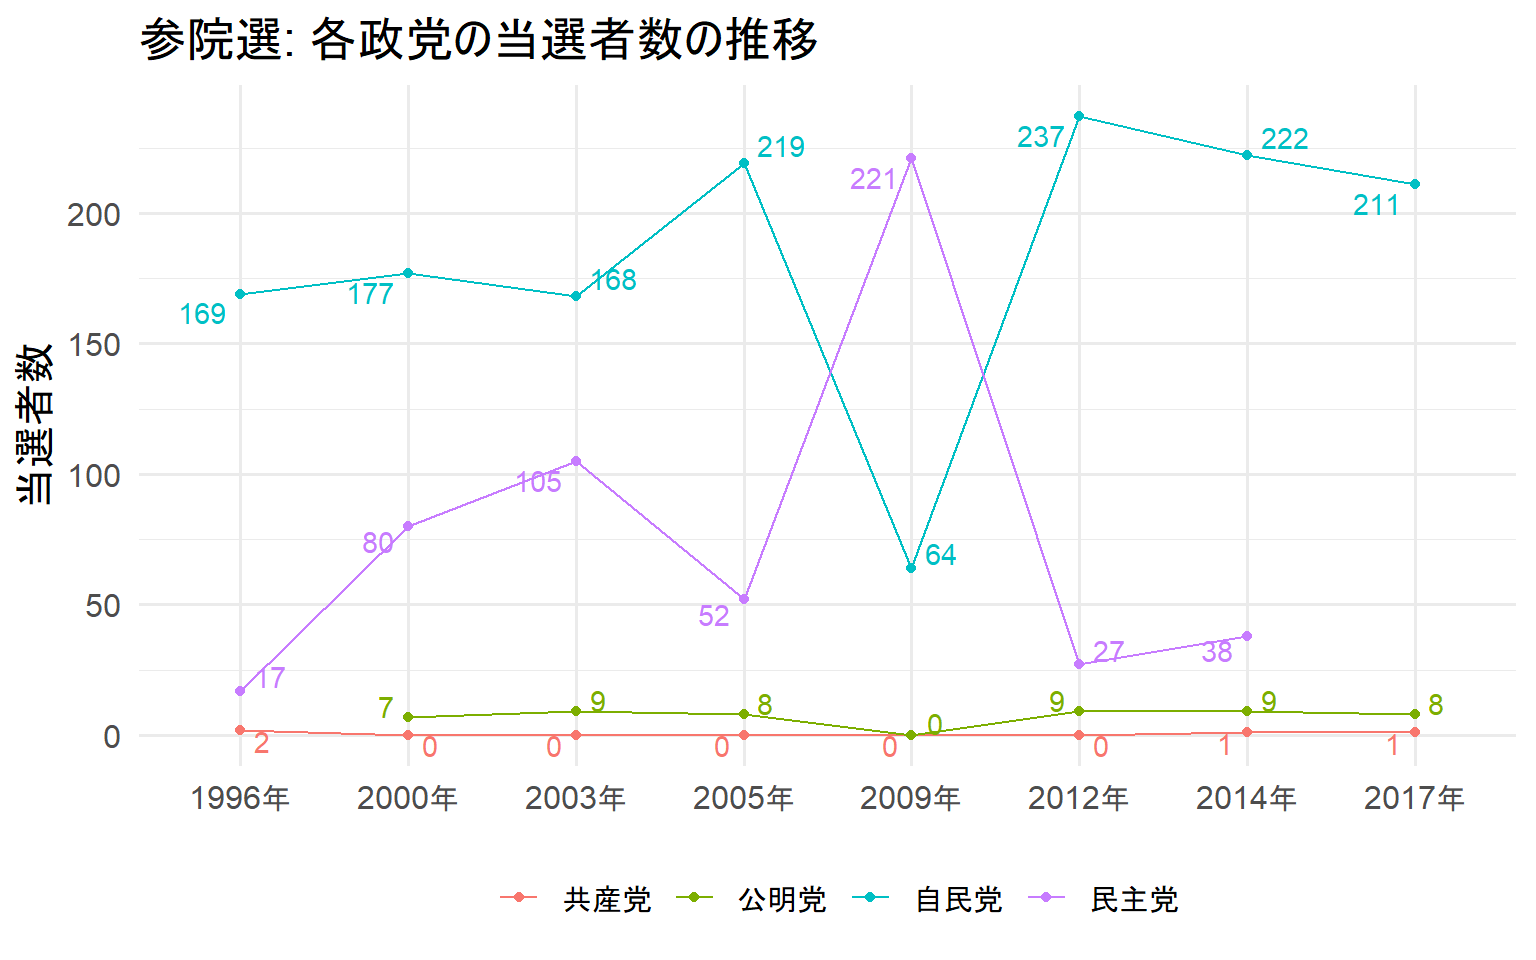
pointの付近に値を載せたい
数値の動きが分かっても、実際の数値が分からない。そんな時はggrepelだ。
geom_text_repel()を使えば、適当にいい感じにpointに被らずに数値を載せることができる。
また、数値の載せ方はランダムであるため、set.seed()で乱数を固定したほうが良いだろう。
library(ggrepel)

set.seed(1)

data %>%
  ggplot(aes(x = year, y = smd,
             group = party_jpn,
             color = party_jpn)) +
  geom_point() +
  geom_line() +
  labs(x = NULL, y = "当選者数",
       title = "参院選: 各政党の当選者数の推移",
       color = "政党") +
  geom_text_repel(aes(label = smd), show.legend = F) +
  theme(legend.title = element_blank(),
        legend.position = "bottom")

x軸のメモリを調整したい
気にしない人もいるだろうが、pointとメモリの間隔が気に入らない。
このままだとありもしない1995年のデータがあるように見えないだろうか?
それに衆院選は5年刻みではない。
そういうときはas.factor()で連続変数ではなく、因子型と指定すれば良いだろう。
また、paste()を使えば単位を付けることが可能だ。
もし、それで順番がぐちゃぐちゃになったら、因子型にする前にarrange()で順番を変えれば良いはず...(たぶん)
set.seed(1)

data %>%
  mutate(year = paste(as.factor(year), "年", sep = "")) %>%
  ggplot(aes(x = year,
             y = smd,
             group = party_jpn,
             color = party_jpn)) +
  geom_point() +
  geom_line() +
  labs(x = NULL, y = "当選者数",
       title = "参院選: 各政党の当選者数の推移",
       color = "政党") +
  geom_text_repel(aes(label = smd), show.legend = F) +
  theme(legend.title = element_blank(),
        legend.position = "bottom")
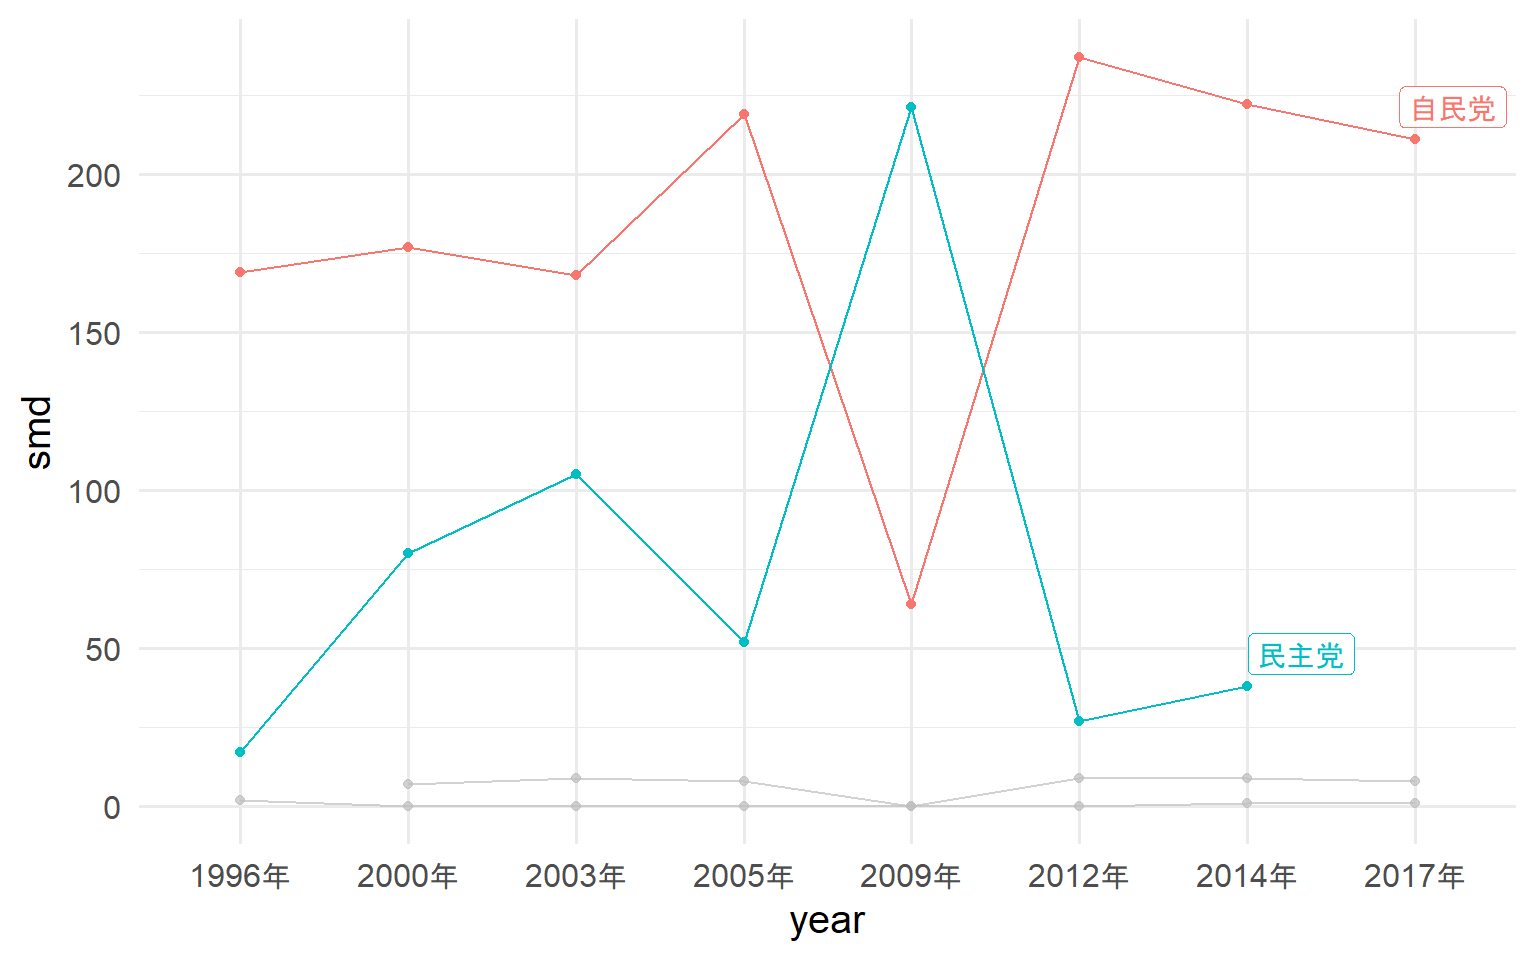
線のハイライト
今回は4つの政党だけを抽出し、可視化しているため見やすい。
しかし、より多くの折れ線を可視化する際には視認性が失われる。
そんな時は、より重要なものにのみ色を付けることで、視認性の高い折れ線グラフを作成できる。
gghighlightはgghighlight(x %in% c("hoge", "hoge"))で重要な個体を強調できる。
library(gghighlight)

data %>%
  mutate(year = paste(as.factor(year), "年", sep = "")) %>%
  ggplot(aes(x = year,
             y = smd,
             group = party_jpn,
             color = party_jpn)) +
  geom_point() +
  geom_line() +
  gghighlight(party_jpn %in% c("自民党", "民主党"))
  labs(x = NULL, y = "当選者数",
       title = "参院選: 各政党の当選者数の推移",
       color = "政党") +
  theme(legend.title = element_blank(),
        legend.position = "bottom")