概要
インピーダンス(電気化学インピーダンス)の解析をpythonで行えるライブラリimpedance.pyを紹介します。測定したNyquist plotを、構築した等価回路モデルへフィッティングしてパラメータを得るところまでやります。
有料ソフト等が不要なので気軽に使えます
基本的にimpedance.pyの公式チュートリアルに沿って説明し、ところどころ補足する程度ですのでよっぽど英語を読みたくない人向けです。
説明が要らない人用に一番下にコードをまとめて掲載してます。
課題
オープンソースのツールだけを使ってインピーダンス解析をしたい
電気化学インピーダンス解析には測定装置に付随する解析ソフトが必要ですが、測定用PCでいちいち解析するのはめんどくさいですよね。。。
しかしソフトは有料のものが多く、ライセンスの関係で自分のPCに入れることもできない。。。
本記事で扱うこと、扱わないこと
扱うこと
impedance.pyについて
扱わないこと
pythonの始め方
"python 使い方"とかで調べてください
依存環境
2020/07/22時点
- Python (>=3.7)
- SciPy (>=1.0)
- NumPy (>=1.14)
- Matplotlib (>=3.0)
- Altair (>=3.0)
最新の情報はこちらからDependencyを確認してください→impedance.py
(1)インストール
PyPIに登録されているのでpip install impedanceでインストール
(2)データのインポート[preprocesing]
測定データはふつうにcsvをread_csvしてpandas.Dataframeとして扱ってもいいが、preprocessingなるものが用意されているのでせっかくだし使います
サンプルデータが公式から用意されているのでこちらからStep2カラム内のexample.csvをダウンロード
from impedance import preprocessing

frequencies, Z = preprocessing.readCSV('./exampleData.csv')
# type(frequencies): <class 'numpy.ndarray'>
# type(frequencies[0]): <class 'numpy.float64'>
# type(Z): <class 'numpy.ndarray'>
# type(Z[0]): <class 'numpy.complex128'>
exampleData.csvの中身はこんな感じ

A列が周波数、B列がZの実部、C列がZの虚部でpreprocessing.readCSVのソースコードをみてもただ単にA列をfrequencies、BC列をcomplex型のZにしてreturnしただけでした。
実は便利なpreprocessing!!###
しょうもない機能かと思ったら、実は使える機能が!
preprocessingはほかにも装置ソフト特有の拡張子にも対応していて(ここ大事)以下のソフトと拡張子に対応しているらしい
| ソフト | 拡張子 |
|---|---|
| gamry | .dta |
| autolab | コンマ区切り(.csv?) |
| parstat | .txt |
| zplot | .z |
| versastudio | .par |
| powersuite | .txt |
| biologic | .mpt |
| chinstruments | .txt |
ソースコードを見ると正規表現などを使ってデータの加工をやってくれてるのでとてもハッピー![]() (筆者は.mptファイルでうまく使えました)
(筆者は.mptファイルでうまく使えました)
使い方は以下
from impedance import preprocessing

frequencies, Z = preprocessing.readFile('ファイルへのpath', instrument='ソフト名')
frequencies, Z = preprocessing.ignoreBelowX(frequencies, Z)
instrumentオプションに上表のソフト名を渡すとファイルの形式を指定できます。
他には
・第一象限を切り取るpreprocessing.ignoreBelowX(freq, Z)
・周波数でデータを切り取るpreprocessing.cropFrequencies(freq, Z, freqmin=0, freqmax=None)
が用意されています
(3)等価回路の作成
from impedance.models.circuits import CustomCircuit

circuit = 'R0-p(R1,C1)-p(R2-Wo1,C2)'
initial_guess = [.01, .01, 100, .01, .05, 100, 1]

circuit = CustomCircuit(circuit, initial_guess=initial_guess)
-で直列、p( , )で並列を表現して文字列としてCustomCircuitクラスに渡すことで等価回路を作成できます。このとき、初期パラメータをinitial_guessオプションにリスト型で渡す必要があります。表現できる回路素子はこちらにまとめられています。
今回はCustomCircuitを用いましたが、ソースコードを見るとRandlesもデフォルトで用意されています。
(4)フィッティング
circuit.fit(frequencies, Z)

params = circuit.parameters_
# [1.65187261e-02 8.67655045e-03 3.32142565e+00 5.38996281e-03
# 6.30927436e-02 2.32520436e+02 2.19541831e-01]

covs = circuit.conf_
# [1.54227642e-04 1.91273738e-04 1.89536697e-01 2.05799010e-04
# 1.93973976e-03 1.62269546e+01 1.75432523e-02]
circuit.fitでフィッティングを実行します。フィッティングアルゴリズムとしてはscipy.optimize.curve_fitが用いられているようです。
フィッティングを行った後、circuit.parameters_とcircuit.conf_でそれぞれフィッティング後のパラメータとパラメータの分散(scipy.optimize.curve_fitが返した共分散行列の対角成分を取り出したもの)を受け取ることができます。
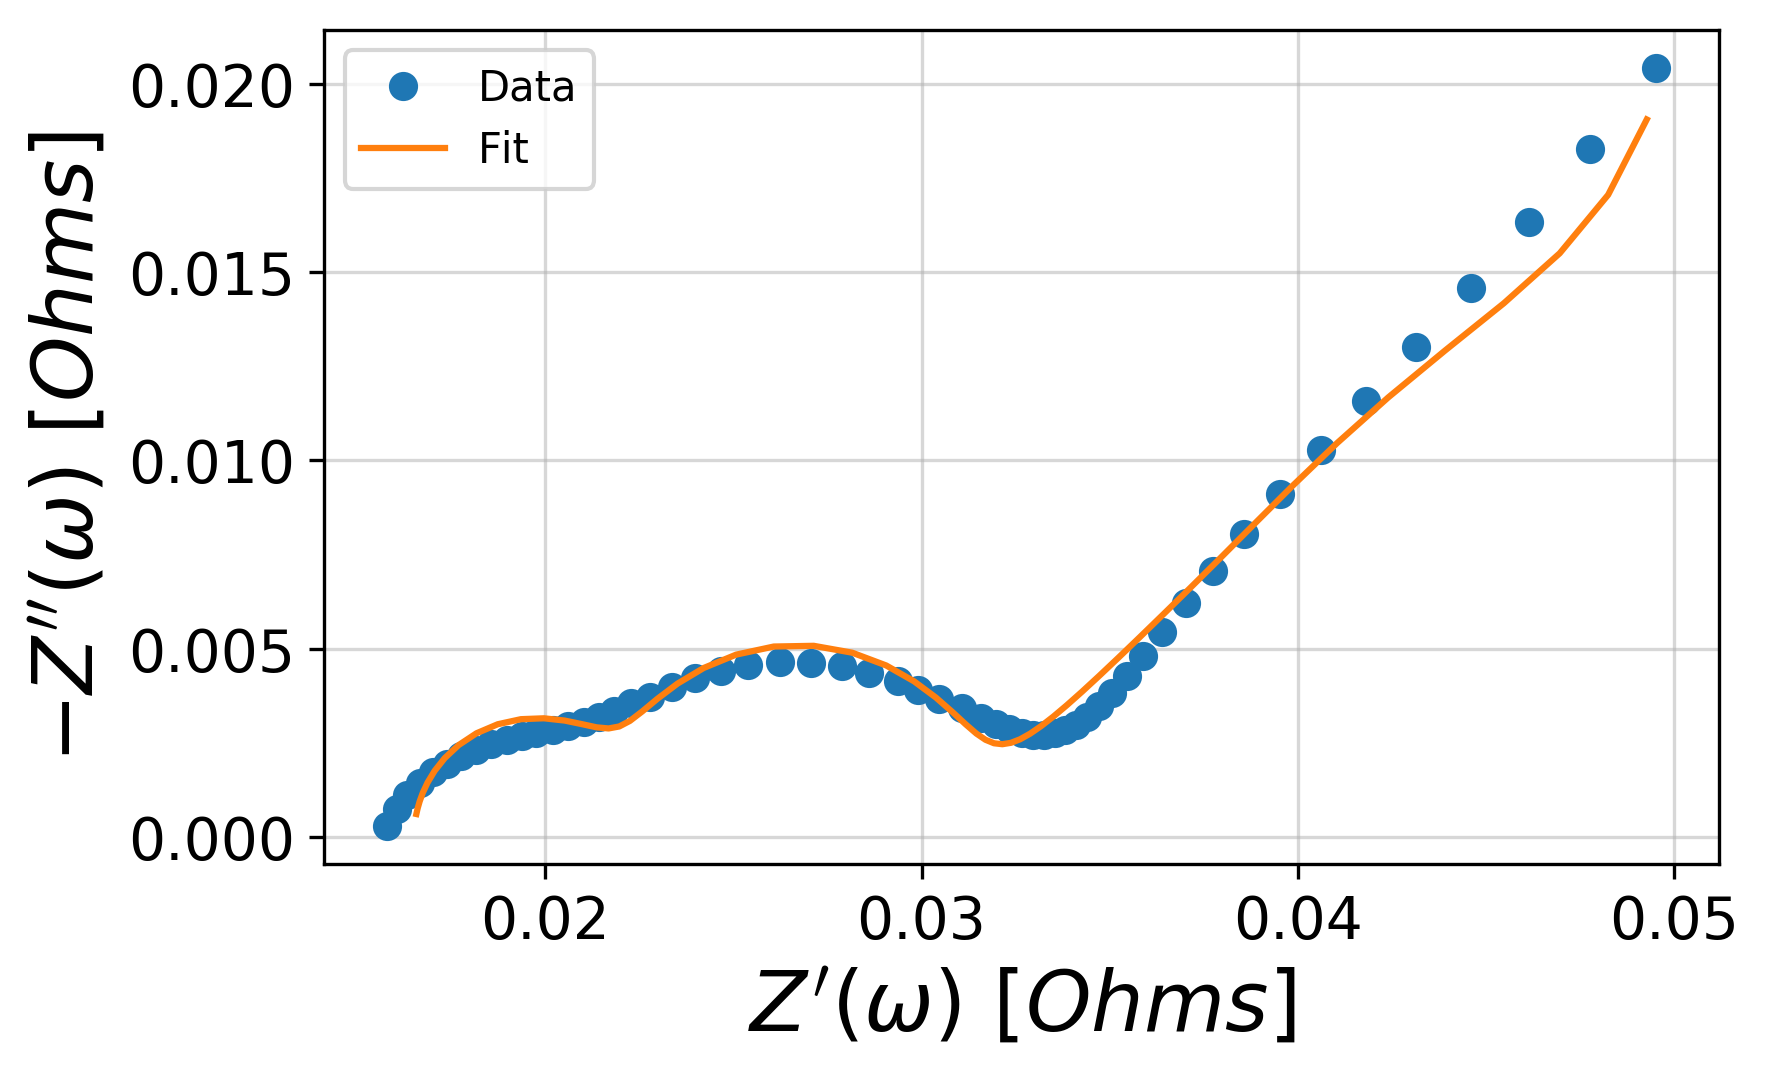
(5)結果の可視化
import matplotlib.pyplot as plt
from impedance.visualization import plot_nyquist

Z_fit = circuit.predict(frequencies)

fig, ax = plt.subplots()
plot_nyquist(ax, Z, fmt='o')
plot_nyquist(ax, Z_fit, fmt='-')

plt.legend(['Data', 'Fit'])
plt.show()
circuit.predict(frequencies)でフィッティングしたパラメータから計算したシミュレーション結果を取得します。
可視化にはmatplotlibおよびaltairをベースにしたvisualizationが用意されていて、nyquistプロットはplot_nyquistで表示させます。ご丁寧に軸ラベルも書いてくれます。
visualizationにはこのほかにplot_bode(bodeプロット)などいろいろ用意されています。(追記予定)
(6)モデル評価
フィッティングした等価回路を評価する指標としてRMSE(二乗平均平方根)を用いることができます。
nは測定点の数。
RMSE = \sqrt{\frac{1}{n}(Z -Z_{fit})}
from impedance.models.circuits.fitting import rmse

model_rmse = rmse(Z, Z_fit)
コード
from matplotlib import pyplot as plt

from impedance import preprocessing
from impedance.models.circuits import CustomCircuit
from impedance.visualization import plot_nyquist
from impedance.models.circuits.fitting import rmse


def main():
    frequencies, Z = preprocessing.readCSV('./exampleData.csv')
    frequencies, Z = preprocessing.ignoreBelowX(frequencies, Z)

    circuit = 'R0-p(R1,C1)-p(R2-Wo1,C2)'
    initial_guess = [.01, .01, 100, .01, .05, 100, 1]

    circuit = CustomCircuit(circuit, initial_guess=initial_guess)
    circuit.fit(frequencies, Z)
    print(circuit.parameters_)
    print(circuit.conf_)
    Z_fit = circuit.predict(frequencies)

    fig, ax = plt.subplots()
    plot_nyquist(ax, Z, fmt='o')
    plot_nyquist(ax, Z_fit, fmt='-')

    plt.legend(['Data', 'Fit'])
    plt.show()

    model_rmse = rmse(Z, Z_fit)
    print(model_rmse)


if __name__ == '__main__':
    main()

